mergemap reads a series of Stata do-files and reports every merge, append, joinby, cross, frlink and frget in them, along with the keep and drop statements that change the row count around them. It executes nothing unless you ask it to. This page walks through each thing it produces, on a worked example of three small do-files that read Stata's auto data, trim it, join it, and save a summary. Every section shows the Stata code that made it; click a grey panel to unfold the code and its output.
Install and make the worked example yourself with:
. display as text "net install mergemap, from(" _char(34) "https://raw.githubus
> ercontent.com/ericabooth/mergemap-stata-public/main/" _char(34) ") replace"
net install mergemap, from("https://raw.githubusercontent.com/ericabooth/mergem
> ap-stata-public/main/") replace

. display as text "mergemap demo"
mergemap demo
Point mergemap at do-files and it prints the receipt: a numbered table with one row per thing it found, in the order the code performs them, each with the file and line to go look at. Nothing is executed; the code is read as text. The same record is also written to a small tab-separated file called the journal, which every later command reads back.
. mergemap gdemo/01_cars.do gdemo/02_join.do gdemo/03_report.do, out(gallery_sc
> an.tsv)

1 of 5 joins flagged: 1 warn.
+-----------------------------------------------------------------------------+
| mergemap receipt: 3 do-files  (33 events, scan mode - nothing executed)     |
+-----------------------------------------------------------------------------+
  # file         line command   keys   using/result    F flags
-------------------------------------------------------------------------------
  1 01_cars.do      9 sysuse           auto.dta
  2 01_cars.do     13 save             cars_all.dta
  3 01_cars.do     16 use              cars_all.dta
  4 01_cars.do     17 keep if          carid <= 37
  5 01_cars.do     18 save             cars_early.dta
  6 01_cars.do     20 use              cars_all.dta
  7 01_cars.do     21 keep if          carid > 37
  8 01_cars.do     22 save             cars_late.dta
  9 01_cars.do     25 use              cars_all.dta
 10 01_cars.do     26 drop if          missing(rep78)
 11 01_cars.do     27 collapse  rep78
 12 01_cars.do     28 save             rep_lookup.dta
 13 01_cars.do     31 use              cars_all.dta
 14 01_cars.do     32 keep vars        carid price
 15 01_cars.do     34 drop vars        price
 16 01_cars.do     35 save             price_index.dta
 17 02_join.do      4 use              cars_early.dta
 18 02_join.do      7 append           cars_late.dta
 19 02_join.do     10 merge m:1 rep78  rep_lookup.dta    keep(1 3): using-only
                                                         will be dropped
 20 02_join.do     13 merge 1:1 carid  price_index.dta
 21 02_join.do     17 drop if          missin...p_mpg)
 22 02_join.do     19 save             cars_joined.dta
 23 03_report.do    4 sysuse           census.dta
 24 03_report.do    5 keep vars        state ...on pop
 25 03_report.do    6 save             census...es.dta
 26 03_report.do    9 use              census...es.dta
 27 03_report.do   10 collapse  region
 28 03_report.do   11 save             region...ls.dta
 29 03_report.do   13 use              cars_joined.dta
 30 03_report.do   14 merge m:1 region region...ls.dta   keep(1 3): using-only
                                                         will be dropped
 31 03_report.do   19 merge m:m region census...es.dta   !! m:m pairs rows by
                                                         row order within key
                                                         (not a join)
 32 03_report.do   20 drop vars        _merge
 33 03_report.do   22 save             demo_a...is.dta
-------------------------------------------------------------------------------
33 events. Severity: !! marks warn and stop.
mergemap: 33 events written to gallery_scan.tsv
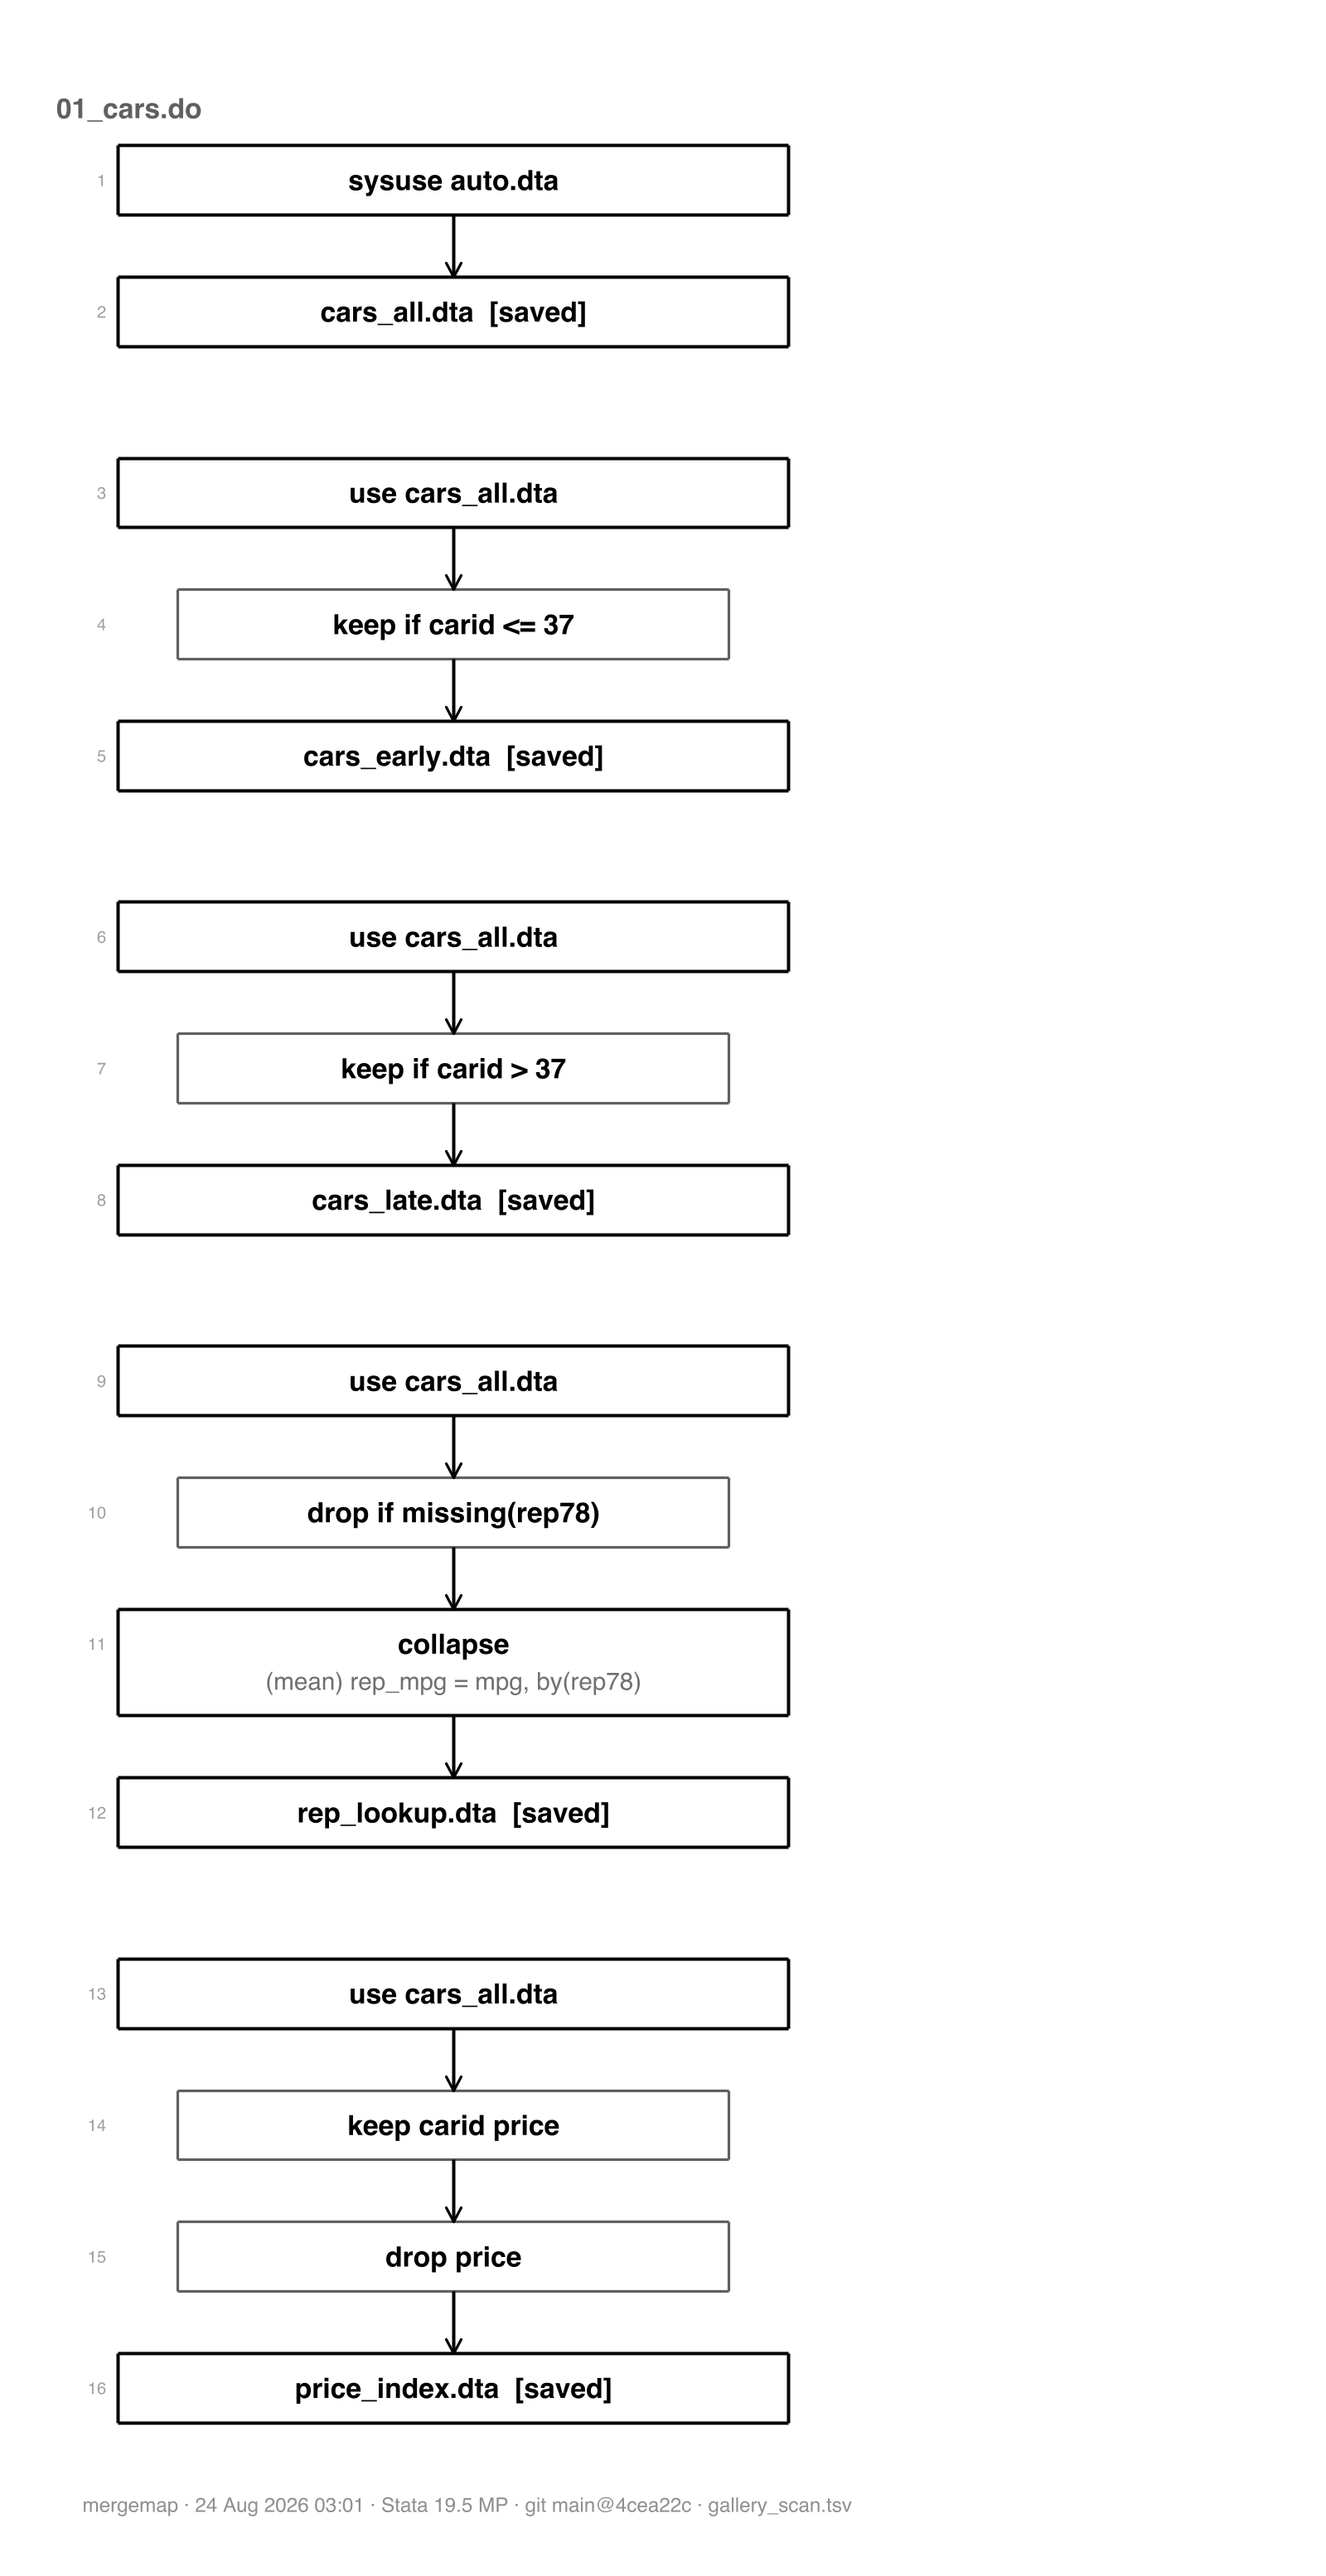
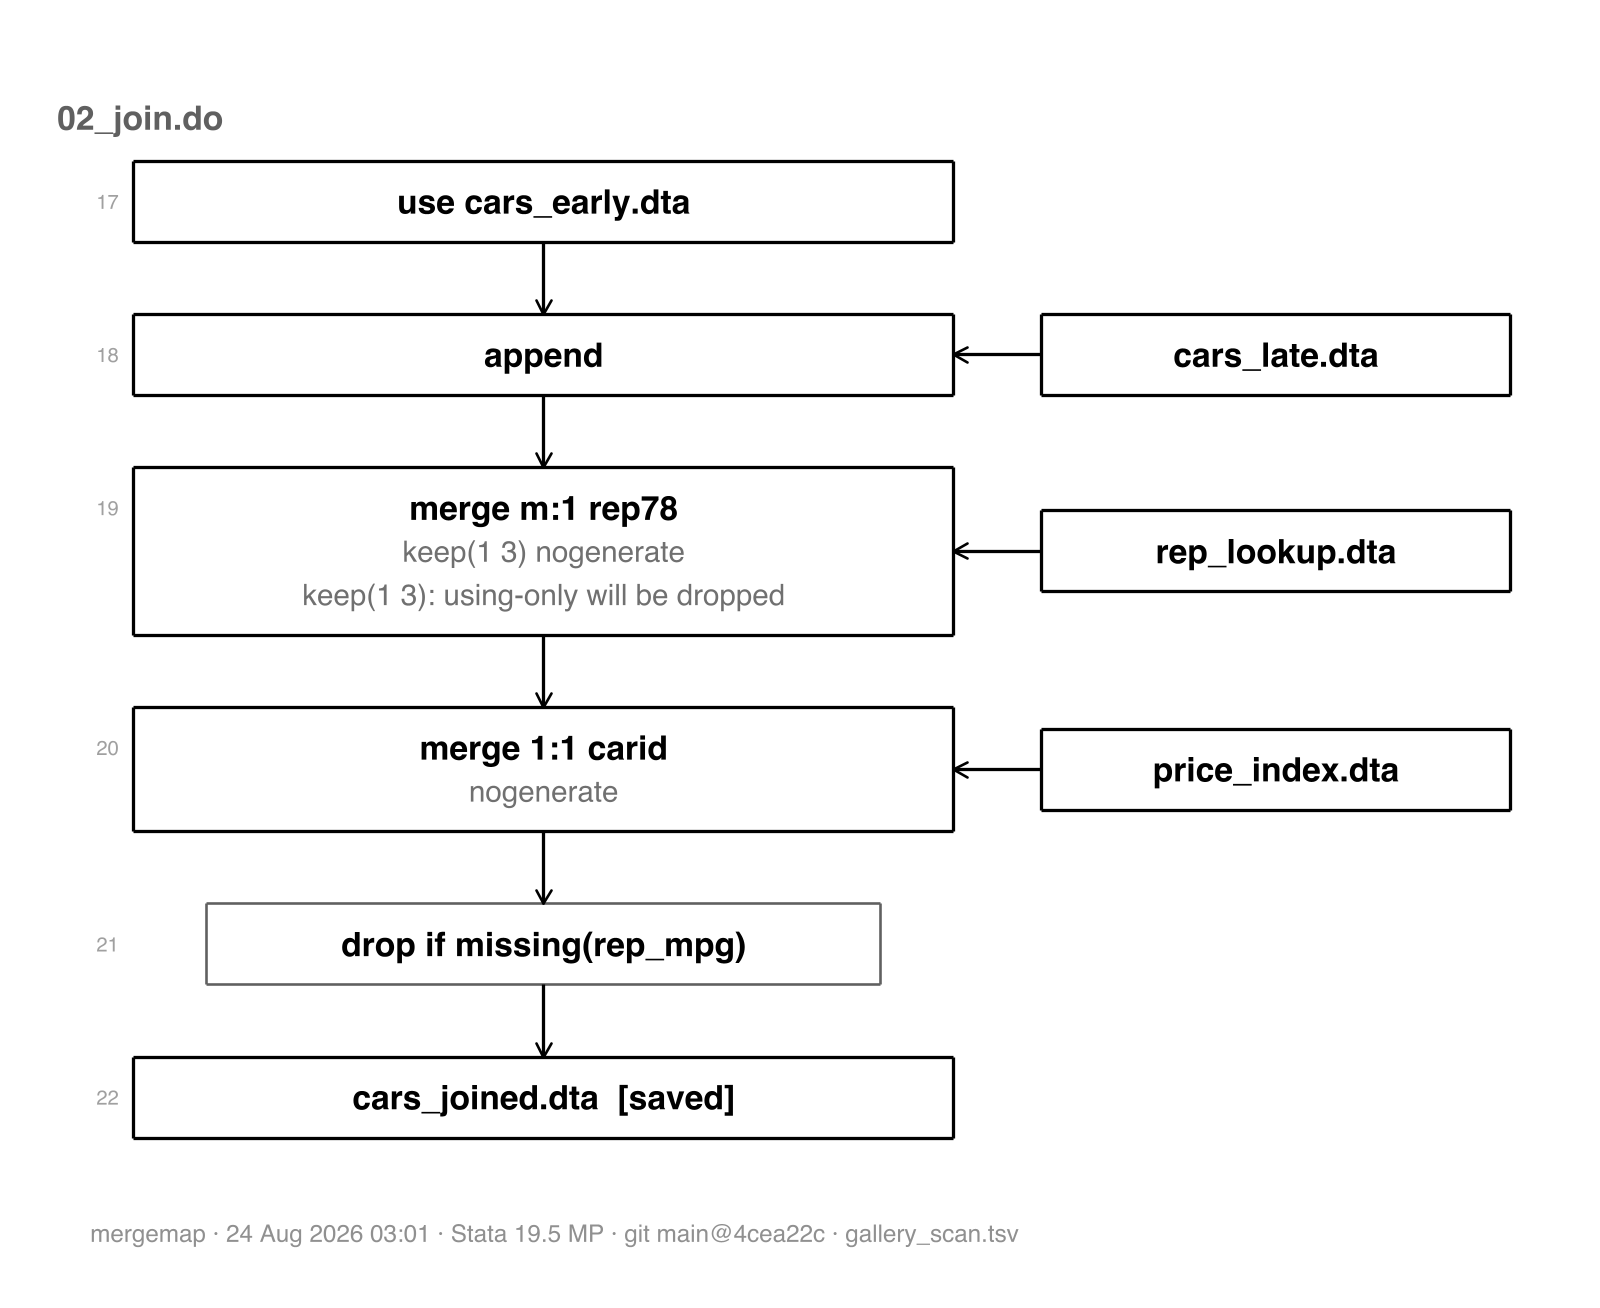
mergemap draw turns the most recent journal into a drawing. Small maps render right in the Results window; past eight join, reshape, and filter events, or for wide layouts, it writes an HTML page instead. Here the Results-window drawing is forced so you can see its style: boxes are datasets, arrows are the flow of data, joined-in files enter from the side, and slim boxes are keep and drop steps.
. mergemap draw gallery_scan.tsv, forcesmcl maxnodes(99)

mergemap diagram: gallery_scan.tsv
(scan mode - nothing executed; style: boxes)

01_cars.do --------------------------------------------------------------------

  +----------------------------------+
  | auto.dta                         |
  +----------------------------------+
        |
        v
  +----------------------------------+
  | cars_all.dta                     |  [saved]
  +----------------------------------+

  +----------------------------------+
  | cars_all.dta                     |
  +----------------------------------+
        |
        v
  [ keep if carid <= 37 ]
        |
        v
  +----------------------------------+
  | cars_early.dta                   |  [saved]
  +----------------------------------+

  +----------------------------------+
  | cars_all.dta                     |
  +----------------------------------+
        |
        v
  [ keep if carid > 37 ]
        |
        v
  +----------------------------------+
  | cars_late.dta                    |  [saved]
  +----------------------------------+

  +----------------------------------+
  | cars_all.dta                     |
  +----------------------------------+
        |
        v
  [ drop if missing(rep78) ]
        |
        v
  +------------------------------------------+
  | collapse (mean) rep_mpg = mpg, by(rep78) |
  +------------------------------------------+
        |
        v
  +----------------------------------+
  | rep_lookup.dta                   |  [saved]
  +----------------------------------+

  +----------------------------------+
  | cars_all.dta                     |
  +----------------------------------+
        |
        v
  [ keep carid price ]
        |
        v
  [ drop price ]
        |
        v
  +----------------------------------+
  | price_index.dta                  |  [saved]
  +----------------------------------+

02_join.do --------------------------------------------------------------------

  +----------------------------------+
  | cars_early.dta                   |
  +----------------------------------+
        |
        |                                +----------------------------------+
        |                                | cars_late.dta                    |
        |                                +----------------------------------+
        |                                  |
        |  append  <-----------------------+
        |
        |                                +----------------------------------+
        |                                | rep_lookup.dta                   |
        |                                +----------------------------------+
        |                                  |
        |  merge m:1 rep78  <--------------+
        |    keep(1 3) nogenerate
        |  keep(1 3): using-only will be dropped
        |
        |                                +----------------------------------+
        |                                | price_index.dta                  |
        |                                +----------------------------------+
        |                                  |
        |  merge 1:1 carid  <--------------+
        |    nogenerate
        |
        v
  [ drop if missing(rep_mpg) ]
        |
        v
  +----------------------------------+
  | cars_joined.dta                  |  [saved]
  +----------------------------------+

03_report.do ------------------------------------------------------------------

  +----------------------------------+
  | census.dta                       |
  +----------------------------------+
        |
        v
  [ keep state region pop ]
        |
        v
  +----------------------------------+
  | census_states.dta                |  [saved]
  +----------------------------------+

  +----------------------------------+
  | census_states.dta                |
  +----------------------------------+
        |
        v
  +---------------------------------------------+
  | collapse (sum) region_pop = pop, by(region) |
  +---------------------------------------------+
        |
        v
  +----------------------------------+
  | region_totals.dta                |  [saved]
  +----------------------------------+

  +----------------------------------+
  | cars_joined.dta                  |
  +----------------------------------+
        |
        |                                +----------------------------------+
        |                                | region_totals.dta                |
        |                                +----------------------------------+
        |                                  |
        |  merge m:1 region  <-------------+
        |    keep(1 3) nogenerate
        |  keep(1 3): using-only will be dropped
        |
        |                                +----------------------------------+
        |                                | census_states.dta                |
        |                                +----------------------------------+
        |                                  |
        |  merge m:m region  <-------------+
        |  !! m:m pairs rows by row order within key (not a join)
        |
        v
  [ drop _merge ]
        |
        v
  +----------------------------------+
  | demo_analysis.dta                |  [saved]
  +----------------------------------+
The HTML page is a single self-contained file: no internet connection, no JavaScript, no external assets. Hover any box for the full record of that event. The page below is embedded from the file the code panel writes; it scrolls in place.
. quietly mergemap draw gallery_scan.tsv, export(html) saving(g_map.html) repla
> ce noopen
A horizontal layout of the same map suits slides and wide screens:
. quietly mergemap draw gallery_scan.tsv, export(html) saving(g_map_h.html) lay
> out(horizontal) replace noopen
For a paper or a Word document, export(png) draws the map through Stata's own graph engine, so it needs nothing installed and matches your other figures' resolution handling. An SVG twin is written alongside each PNG. A map too dense for one readable image splits itself into one page per do-file, which is what happens here:
. mergemap draw gallery_scan.tsv, export(png) saving(g_map) replace
_mm_rendertw: page 1 has 15 join+transform+filter events, above this renderer's
>  cap of 12.
    a native-graph diagram this dense is not readable; use the HTML export inst
> ead:
        . renderhtml using "gallery_scan.tsv", saving(diagram.html)
    (or split it with page(dofile), or raise the cap with maxnodes(#))
mergemap draw: retrying with one page per do-file, page(dofile)
_mm_rendertw: wrote g_map_01_cars.png and g_map_01_cars.svg (vertical, 16 event
> s, 6 join+transform+filter)
_mm_rendertw: wrote g_map_02_join.png and g_map_02_join.svg (vertical, 6 events
> , 4 join+transform+filter)
_mm_rendertw: wrote g_map_03_report.png and g_map_03_report.svg (vertical, 11 e
> vents, 5 join+transform+filter)
_mm_rendertw: 3 pages, one per do-file
Mermaid and DOT are plain-text diagram languages: the export is a small text file naming the boxes and arrows, and other software draws it. Mermaid text renders by itself when pasted into GitHub, Quarto, VS Code, or mermaid.live, which makes it the right export when you want the map inside a README or a wiki instead of as an image file. DOT is the same idea in Graphviz's language. The diagram below is the mermaid export of the demo map, drawn live by this page:
. mergemap draw gallery_scan.tsv, export(mermaid) saving(g_map) replace
_mm_rendertext: gallery_scan.tsv -> g_map_td.mmd g_map_td.md g_map_lr.mmd g_map
> _lr.md

. type g_map_td.mmd
%%{init: {'theme':'base','themeVariables':{'fontFamily':'Helvetica, Arial, sans
> -serif','fontSize':'14px','primaryColor':'#ffffff','primaryTextColor':'#20202
> 0','primaryBorderColor':'#606060','lineColor':'#606060','secondaryColor':'#f4
> f4f4','tertiaryColor':'#fafafa','clusterBkg':'#fbfbfb','clusterBorder':'#b0b0
> b0','edgeLabelBackground':'#ffffff','titleColor':'#202020'}}}%%
%% mergemap _mm_rendertext 0.2.0 - journal gallery_scan.tsv - rendered 24 Aug 2
> 026 03:01:05 - Stata 19.5 MP - git main@4cea22c
flowchart TD
  accTitle: mergemap data-flow map of gallery_scan.tsv
  accDescr {
    3 do-files, 18 dataset events, 5 joins and 8 filters, of which 1 are flagge
> d. Boxes are datasets or the dataset in memory; edges carry the command, its
> keys and its counts. Two exclamation marks flag an event that needs attention
> .
  }
  classDef default fill:#ffffff,stroke:#606060,color:#202020;
  classDef mmfilter fill:#f4f4f4,stroke:#909090,color:#202020;
  classDef mmnote fill:#fafafa,stroke:#b0b0b0,color:#404040;
  classDef mmwarn fill:#ffffff,stroke:#4a6d8c,stroke-width:2.5px,color:#202020;
  classDef mmstop fill:#ffffff,stroke:#4a6d8c,stroke-width:4px,color:#202020;
  subgraph sg1["01_cars.do"]
    d1["auto.dta"]
    d2["cars_all.dta [saved]"]
    s4(["keep if carid #60;= 37"])
    d3["cars_early.dta [saved]"]
    s7(["keep if carid > 37"])
    d5["cars_late.dta [saved]"]
    s10(["drop if missing(rep78)"])
    s11["collapse (mean) rep_mpg = mpg, by(rep78)"]
    d11["rep_lookup.dta [saved]"]
    s14(["keep vars carid price"])
    s15(["drop vars price"])
    d9["price_index.dta [saved]"]
  end
  subgraph sg2["02_join.do"]
    s18["work"]
    s19["work<br/>keep(1 3): using-only will be dropped"]
    s20["work"]
    s21(["drop if missing(rep_mpg)"])
    d4["cars_joined.dta [saved]"]
  end
  subgraph sg3["03_report.do"]
    d6["census.dta"]
    s24(["keep vars state region pop"])
    d7["census_states.dta [saved]"]
    s27["collapse (sum) region_pop = pop, by(region)"]
    d10["region_totals.dta [saved]"]
    s30["work<br/>keep(1 3): using-only will be dropped"]
    s31["work<br/>!! m:m pairs rows by row order within key (not a join)"]
    s32(["drop vars _merge"])
    d8["demo_analysis.dta [saved]"]
  end
  d1 --> d2
  d2 --> s4
  s4 --> d3
  d2 --> s7
  s7 --> d5
  d2 --> s10
  s10 --> s11
  s11 --> d11
  d2 --> s14
  s14 --> s15
  s15 --> d9
  d3 -- "append" --> s18
  d5 --> s18
  s18 -- "merge m:1 rep78<br/>keep(1 3) nogenerate" --> s19
  d11 -. "using-only dropped by keep(1 3)" .-> s19
  s19 -- "merge 1:1 carid<br/>nogenerate" --> s20
  d9 --> s20
  s20 --> s21
  s21 --> d4
  d6 --> s24
  s24 --> d7
  d7 --> s27
  s27 --> d10
  d4 -- "merge m:1 region<br/>keep(1 3) nogenerate" --> s30
  d10 -. "using-only dropped by keep(1 3)" .-> s30
  s30 -- "merge m:m region" --> s31
  d7 --> s31
  s31 --> s32
  s32 --> d8
  class s4 mmfilter;
  class s7 mmfilter;
  class s10 mmfilter;
  class s14 mmfilter;
  class s15 mmfilter;
  class s21 mmfilter;
  class s24 mmfilter;
  class s31 mmwarn;
  class s32 mmfilter;
  linkStyle 25,26 stroke:#4a6d8c,stroke-width:2px;
%%{init: {'theme':'base','themeVariables':{'fontFamily':'Helvetica, Arial, sans-serif','fontSize':'14px','primaryColor':'#ffffff','primaryTextColor':'#202020','primaryBorderColor':'#606060','lineColor':'#606060','secondaryColor':'#f4f4f4','tertiaryColor':'#fafafa','clusterBkg':'#fbfbfb','clusterBorder':'#b0b0b0','edgeLabelBackground':'#ffffff','titleColor':'#202020'}}}%%
%% mergemap _mm_rendertext 0.2.0 - journal gallery_scan.tsv - rendered 24 Aug 2026 03:01:05 - Stata 19.5 MP - git main@4cea22c
flowchart TD
  accTitle: mergemap data-flow map of gallery_scan.tsv
  accDescr {
    3 do-files, 18 dataset events, 5 joins and 8 filters, of which 1 are flagged. Boxes are datasets or the dataset in memory; edges carry the command, its keys and its counts. Two exclamation marks flag an event that needs attention.
  }
  classDef default fill:#ffffff,stroke:#606060,color:#202020;
  classDef mmfilter fill:#f4f4f4,stroke:#909090,color:#202020;
  classDef mmnote fill:#fafafa,stroke:#b0b0b0,color:#404040;
  classDef mmwarn fill:#ffffff,stroke:#4a6d8c,stroke-width:2.5px,color:#202020;
  classDef mmstop fill:#ffffff,stroke:#4a6d8c,stroke-width:4px,color:#202020;
  subgraph sg1["01_cars.do"]
    d1["auto.dta"]
    d2["cars_all.dta [saved]"]
    s4(["keep if carid #60;= 37"])
    d3["cars_early.dta [saved]"]
    s7(["keep if carid > 37"])
    d5["cars_late.dta [saved]"]
    s10(["drop if missing(rep78)"])
    s11["collapse (mean) rep_mpg = mpg, by(rep78)"]
    d11["rep_lookup.dta [saved]"]
    s14(["keep vars carid price"])
    s15(["drop vars price"])
    d9["price_index.dta [saved]"]
  end
  subgraph sg2["02_join.do"]
    s18["work"]
    s19["work
keep(1 3): using-only will be dropped"]
    s20["work"]
    s21(["drop if missing(rep_mpg)"])
    d4["cars_joined.dta [saved]"]
  end
  subgraph sg3["03_report.do"]
    d6["census.dta"]
    s24(["keep vars state region pop"])
    d7["census_states.dta [saved]"]
    s27["collapse (sum) region_pop = pop, by(region)"]
    d10["region_totals.dta [saved]"]
    s30["work
keep(1 3): using-only will be dropped"]
    s31["work
!! m:m pairs rows by row order within key (not a join)"]
    s32(["drop vars _merge"])
    d8["demo_analysis.dta [saved]"]
  end
  d1 --> d2
  d2 --> s4
  s4 --> d3
  d2 --> s7
  s7 --> d5
  d2 --> s10
  s10 --> s11
  s11 --> d11
  d2 --> s14
  s14 --> s15
  s15 --> d9
  d3 -- "append" --> s18
  d5 --> s18
  s18 -- "merge m:1 rep78
keep(1 3) nogenerate" --> s19
  d11 -. "using-only dropped by keep(1 3)" .-> s19
  s19 -- "merge 1:1 carid
nogenerate" --> s20
  d9 --> s20
  s20 --> s21
  s21 --> d4
  d6 --> s24
  s24 --> d7
  d7 --> s27
  s27 --> d10
  d4 -- "merge m:1 region
keep(1 3) nogenerate" --> s30
  d10 -. "using-only dropped by keep(1 3)" .-> s30
  s30 -- "merge m:m region" --> s31
  d7 --> s31
  s31 --> s32
  s32 --> d8
  class s4 mmfilter;
  class s7 mmfilter;
  class s10 mmfilter;
  class s14 mmfilter;
  class s15 mmfilter;
  class s21 mmfilter;
  class s24 mmfilter;
  class s31 mmwarn;
  class s32 mmfilter;
  linkStyle 25,26 stroke:#4a6d8c,stroke-width:2px;
And the DOT version of the same map, as text:
. mergemap draw gallery_scan.tsv, export(dot) saving(g_map) replace
_mm_rendertext: gallery_scan.tsv -> g_map_tb.dot g_map_lr.dot

. type g_map_tb.dot
// mergemap _mm_rendertext 0.2.0 - journal gallery_scan.tsv - rendered 24 Aug 2
> 026 03:01:05 - Stata 19.5 MP - git main@4cea22c
// mergemap data-flow map of gallery_scan.tsv
digraph mergemap {
  rankdir=TB;
  graph [fontname="Helvetica", fontsize=11, labeljust="l", labelloc="b", fontco
> lor="#707070", label="mergemap _mm_rendertext 0.2.0 - journal gallery_scan.ts
> v - rendered 24 Aug 2026 03:01:05 - Stata 19.5 MP - git main@4cea22c"];
  node  [shape=box, fontname="Helvetica", fontsize=10, color="#606060", fontcol
> or="#202020"];
  edge  [fontname="Helvetica", fontsize=9, color="#606060", fontcolor="#202020"
> ];
  subgraph cluster_1 {
    label="01_cars.do";
    color="#909090";
    d1 [label="auto.dta"];
    d2 [label="cars_all.dta [saved]"];
    s4 [label="keep if carid <= 37", style=rounded];
    d3 [label="cars_early.dta [saved]"];
    s7 [label="keep if carid > 37", style=rounded];
    d5 [label="cars_late.dta [saved]"];
    s10 [label="drop if missing(rep78)", style=rounded];
    s11 [label="collapse (mean) rep_mpg = mpg, by(rep78)"];
    d11 [label="rep_lookup.dta [saved]"];
    s14 [label="keep vars carid price", style=rounded];
    s15 [label="drop vars price", style=rounded];
    d9 [label="price_index.dta [saved]"];
  }
  subgraph cluster_2 {
    label="02_join.do";
    color="#909090";
    s18 [label="work"];
    s19 [label="work\nkeep(1 3): using-only will be dropped"];
    s20 [label="work"];
    s21 [label="drop if missing(rep_mpg)", style=rounded];
    d4 [label="cars_joined.dta [saved]"];
  }
  subgraph cluster_3 {
    label="03_report.do";
    color="#909090";
    d6 [label="census.dta"];
    s24 [label="keep vars state region pop", style=rounded];
    d7 [label="census_states.dta [saved]"];
    s27 [label="collapse (sum) region_pop = pop, by(region)"];
    d10 [label="region_totals.dta [saved]"];
    s30 [label="work\nkeep(1 3): using-only will be dropped"];
    s31 [label="work\n!! m:m pairs rows by row order within key (not a join)",
> color="#4a6d8c", penwidth=2];
    s32 [label="drop vars _merge", style=rounded];
    d8 [label="demo_analysis.dta [saved]"];
  }
  d1 -> d2;
  d2 -> s4;
  s4 -> d3;
  d2 -> s7;
  s7 -> d5;
  d2 -> s10;
  s10 -> s11;
  s11 -> d11;
  d2 -> s14;
  s14 -> s15;
  s15 -> d9;
  d3 -> s18 [label="append"];
  d5 -> s18;
  s18 -> s19 [label="merge m:1 rep78\nkeep(1 3) nogenerate"];
  d11 -> s19 [label="using-only dropped by keep(1 3)", style=dashed];
  s19 -> s20 [label="merge 1:1 carid\nnogenerate"];
  d9 -> s20;
  s20 -> s21;
  s21 -> d4;
  d6 -> s24;
  s24 -> d7;
  d7 -> s27;
  s27 -> d10;
  d4 -> s30 [label="merge m:1 region\nkeep(1 3) nogenerate"];
  d10 -> s30 [label="using-only dropped by keep(1 3)", style=dashed];
  s30 -> s31 [label="merge m:m region", color="#4a6d8c"];
  d7 -> s31 [color="#4a6d8c"];
  s31 -> s32;
  s32 -> d8;
}
Everything above came from a scan, which reads code and never executes it, so it cannot know how many rows matched. Run mode executes the do-files with instrumentation around each join and records what actually happened: rows in and out, the _merge breakdown, duplicate keys, and what share of each side took part. Your results are unchanged; the wrappers call the real commands and pass every option through. The journal below was written before this page was built, by gallery_prep.do, because run mode and webdoc2 (the package that builds this page) both need control of how a do-file executes, so the two are kept apart.
The receipt from the run, now with counts:
. mergemap receipt gallery_run.tsv

3 of 5 joins flagged: 3 warn.
plus 4 flagged event(s) outside the joins.
+-----------------------------------------------------------------------------+
| mergemap receipt: gallery_run.tsv  (31 events, existing journal)            |
+-----------------------------------------------------------------------------+
  # file         line command   using/result   n out F flags
-------------------------------------------------------------------------------
  1 01_cars.do     13 save      cars_all.dta      74
  2 01_cars.do     16 use       cars_all.dta      74   produced by 01_cars.do
                                                       line 13
  3 01_cars.do     17 keep if   carid <= 37       37   removed 37 rows
                                                       (50.0%), 37 remaining
  4 01_cars.do     18 save      cars_early.dta    37
  5 01_cars.do     20 use       cars_all.dta      74   produced by 01_cars.do
                                                       line 13
  6 01_cars.do     21 keep if   carid > 37        37   removed 37 rows
                                                       (50.0%), 37 remaining
  7 01_cars.do     22 save      cars_late.dta     37
  8 01_cars.do     25 use       cars_all.dta      74   produced by 01_cars.do
                                                       line 13
  9 01_cars.do     26 drop if   missing(rep78)    69   removed 5 rows (6.8%),
                                                       69 remaining
 10 01_cars.do     27 collapse                     5
 11 01_cars.do     28 save      rep_lookup.dta     5
 12 01_cars.do     31 use       cars_all.dta      74   produced by 01_cars.do
                                                       line 13
 13 01_cars.do     32 keep      carid price       74   removed 12 variables, 2
                                                       remaining
 14 01_cars.do     34 drop      price             74   removed 1 variables, 2
                                                       remaining
 15 01_cars.do     35 save      price_...x.dta    74
 16 02_join.do      4 use       cars_early.dta    37   produced by 01_cars.do
                                                       line 18
 17 02_join.do      7 append    cars_late.dta     74
 18 02_join.do     10 merge m:1 rep_lookup.dta    74   5 master-only kept
 19 02_join.do     13 merge 1:1 price_...x.dta    74
 20 02_join.do     17 drop if   missin..._mpg)    69   removed 5 rows (6.8%),
                                                       69 remaining
 21 02_join.do     19 save      cars_j...d.dta    69
 22 03_report.do    5 keep      state ...n pop    50   removed 10 variables, 3
                                                       remaining
 23 03_report.do    6 save      census...s.dta    50
 24 03_report.do    9 use       census...s.dta    50   produced by
                                                       03_report.do line 6
 25 03_report.do   10 collapse                     4
 26 03_report.do   11 save      region...s.dta     4
 27 03_report.do   13 use       cars_j...d.dta    69   produced by 02_join.do
                                                       line 19
 28 03_report.do   14 merge m:1 region...s.dta    69   !! key type drift:
                                                       region: byte vs int
 29 03_report.do   19 merge m:m census...s.dta    69   !! m:m pairs rows by
                                                       row order within key
                                                       (not a join)
 30 03_report.do   20 drop      _merge            69   removed 1 variables, 19
                                                       remaining
 31 03_report.do   22 save      demo_a...s.dta    69
-------------------------------------------------------------------------------
31 events. Severity: !! marks warn and stop.
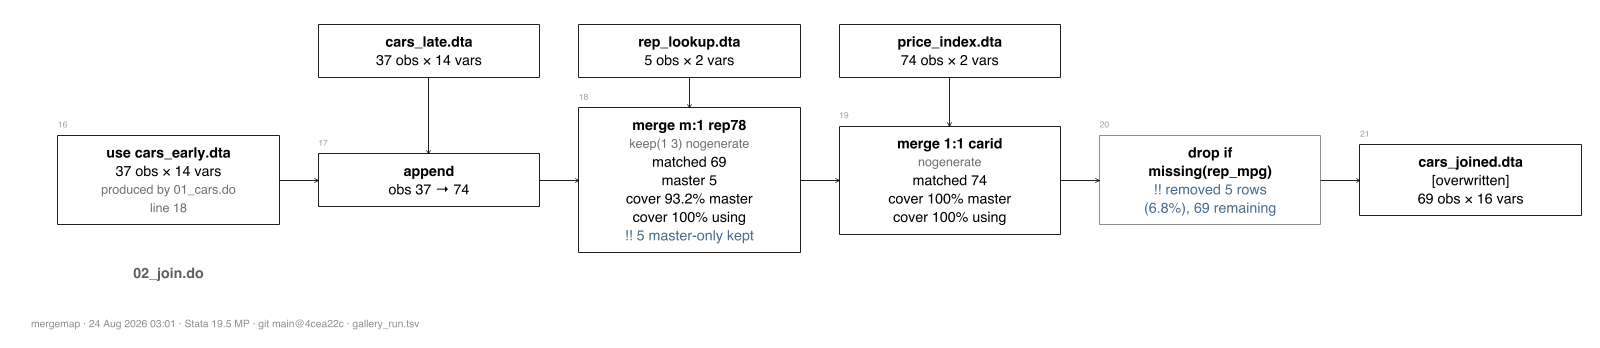
The same map, drawn with the counts in it:
. quietly mergemap draw gallery_run.tsv, export(html) saving(g_map_run.html) re
> place noopen
The run map also draws through Stata's own graph engine, laid out horizontally: one row of boxes per do-file, in a shape that fits a slide or a wide page. A dense map splits itself into one page per do-file, and the page below is the second one, where the joins happen:
. mergemap draw gallery_run.tsv, export(png) saving(g_run_h) layout(horizontal)
>  replace
_mm_rendertw: page 1 has 15 join+transform+filter events, above this renderer's
>  cap of 12.
    a native-graph diagram this dense is not readable; use the HTML export inst
> ead:
        . renderhtml using "gallery_run.tsv", saving(diagram.html)
    (or split it with page(dofile), or raise the cap with maxnodes(#))
mergemap draw: retrying with one page per do-file, page(dofile)
_mm_rendertw: wrote g_run_h_01_cars.png and g_run_h_01_cars.svg (horizontal, 15
>  events, 6 join+transform+filter)
_mm_rendertw: wrote g_run_h_02_join.png and g_run_h_02_join.svg (horizontal, 6
> events, 4 join+transform+filter)
_mm_rendertw: wrote g_run_h_03_report.png and g_run_h_03_report.svg (horizontal
> , 10 events, 5 join+transform+filter)
_mm_rendertw: 3 pages, one per do-file
One event in depth, straight from the journal:
. mergemap detail 6 gallery_run.tsv

event 6: keep if   (01_cars.do line 21)
  --------------------------------------------------------------
  class       filter
  result      work
  rows        74 -> 37
  vars        14 -> 14
  options     if carid > 37
  severity    warn
  flags       removed 37 rows (50.0%), 37 remaining
  --------------------------------------------------------------
mergemap sql is for the moments when you, a student, or a collaborator from the R or Python side needs to see what a Stata merge form does to rows. It prints a table matching each Stata form to its name in SQL, dplyr, and pandas, and draws any form as a worked example: two toy tables, the command, and the result, with the rule for how many rows come out. The subcommand is named sql because that is where the shared join vocabulary comes from; nothing about it requires SQL, and it never touches your data.
. mergemap sql

mergemap sql: what each Stata form is, in three other languages

  Stata                           SQL                       dplyr             p
> andas how=
  -----------------------------------------------------------------------------
---------------
  merge 1:1 k using B             FULL OUTER JOIN           full_join         o
> uter
  merge .., keep(3)               INNER JOIN                inner_join        i
> nner
  merge .., keep(1 3)             LEFT JOIN                 left_join         l
> eft
  merge .., keep(2 3)             RIGHT JOIN                right_join        r
> ight
  merge .., keep(1)               anti join                 anti_join         l
> eft_anti
  merge m:1 k using B             many-to-one lookup        left_join         v
> alidate m:1
  merge 1:m k using B             one-to-many fan-out       left_join         v
> alidate 1:m
  merge m:m k using B             (no equivalent: not a join)--
> --
  joinby k using B                INNER JOIN, dup keys      inner_join        v
> alidate m:m
  cross using B                   CROSS JOIN                cross_join        c
> ross
  append using B                  UNION ALL (by name)       bind_rows         c
> oncat
  frlink m:1 k, frame(B)          declares the FK           join_by           -
> -
  frget v, from(lnk)              LEFT JOIN projection      left_join         l
> eft
  collapse (mean) x, by(k)        GROUP BY                  summarise         g
> roupby.agg
  reshape long / wide             UNPIVOT / PIVOT           pivot_longer/widerm
> elt / pivot
  -----------------------------------------------------------------------------
---------------

  Pictures, one per form:
    . mergemap sql full      the default merge (full outer join)
    . mergemap sql left      merge m:1 .., keep(1 3) (a left join)
    . mergemap sql inner     merge .., keep(3)
    . mergemap sql fanout    merge 1:m (one row becomes many)
    . mergemap sql joinby    the real many-to-many
    . mergemap sql append    stacking, not joining
    . mergemap sql cross     every row against every row
    . mergemap sql mm        merge m:m, the warning case
One form drawn as a worked example. The m:m case reads as a warning on purpose: merge m:m pairs rows by the order they happen to be in, and joinby is the true many-to-many:
. mergemap sql joinby

mergemap sql: joinby id using B  (the real many-to-many)
within each key, every master row is paired with every using row: a cross
product inside the key

  master              using               result
  +------------+    +------------+    +------------------+
  | id   x     |    | id   y     |    | id   x    y      |
  | 1    a     |    | 1    p     |    | 1    a    p      |
  | 1    b     |    | 1    q     |    | 1    a    q      |
  +------------+    +------------+    | 1    b    p      |
                                      | 1    b    q      |
                                      +------------------+

  size rule, per key: rows = rows(master) x rows(using);  4 = 2 x 2
  2 rows and 2 rows made 4: joins can multiply, which is why mergemap
  reports row multiplication on every joinby

  SQL: INNER JOIN, dup keys  |  dplyr: many-to-many  |  pandas: validate="m:m"
The same diagram is available for your own joins: mergemap detail with the draw option takes one event from the journal and draws its row pairing with the observed counts in place of the toy rows.
. mergemap detail 6 gallery_run.tsv, draw

event 6: keep if   (01_cars.do line 21)
  --------------------------------------------------------------
  class       filter
  result      work
  rows        74 -> 37
  vars        14 -> 14
  options     if carid > 37
  severity    warn
  flags       removed 37 rows (50.0%), 37 remaining
  --------------------------------------------------------------
mergemap detail, draw diagrams join events; event 6 is a filter
A real build can record thousands of events, and most of them are not joins. The journal and the receipt always keep every event; the drawing is where you choose what to look at. Each option hides one kind of event, the options combine, and draw prints a line saying exactly what it hid. filesonly leaves the joins between named files; an if on the journal's own columns cuts any way the record can be sliced; paths(base) and root() shorten long file paths in the labels.
. quietly mergemap draw gallery_run.tsv, filesonly export(html) saving(g_map_fi
> les.html) replace noopen

. display as text "hidden: " r(hidden)
hidden: hidden: 2 transforms, 8 filters (4 on rows, 4 on variables); 21 of 31 e
> vents drawn
The record itself is never cut. Export it whole, as a dataset or as a three-sheet Excel workbook (every event; the joins with their counts; every keep and drop with the rows it removed), sortable and filterable in Excel:
. mergemap export gallery_run.tsv, saving(g_journal.xlsx) replace
mergemap export: 31 events from gallery_run.tsv
             to g_journal.xlsx
             sheets: events (31), joins (5), filters (8)
This page was generated by gallery.do in the mergemap repository, using the webdoc2 package. See the README for installation and the help file (help mergemap) for every option.