A working library of open-source tools I've built for research, evaluation, and data workflows — mostly in Stata and Python. Search or pick a problem below, then click a name for the source on GitHub, or the SSC tag to install from the SSC archive. Full index at github.com/ericabooth.

All Dashboards & charts APIs & integrations Data collection Cleaning & prep Estimation & research Automation & AI Learn the methods Works in progress

Turn Stata output into live web dashboards & charts

Publish interactive HTML/JS pages — charts, dashboards, tables, and maps — straight from a Stata do-file.

Code
Live demos

Connect Stata to the cloud & other tools

Call web APIs, read/write Google Sheets, work off Google Drive, pull in R data, query an LLM, and convert or edit any file — without leaving Stata.

Code

Pull hard-to-get public data

Scrapers and downloaders for Texas education, health price-transparency, and Stata package archives.

Code

Clean, reshape, document & release data

Match and validate records, combine and reshape files, rebuild variables, generate codebooks, track data lineage, and de-identify data for safe public release.

Match & validate
Reshape & combine
Document & trace
De-identify for release
Format & utilities

Estimate, model & replicate research

Estimation and inference tools for evaluation work — matching, shrinkage, multilevel R-squared, simulation, conformal and nonparametric methods — plus applied research and replication materials.

Estimation & inference
Applied research & replication

Automate workflows with Python & AI

Scaffold and back up whole analysis projects, install what a do-file needs, generate timesheets, auto-build multicam video timelines, and convert documents.

Set up & maintain projects
Documents, media & pipelines

Learn the methods

A draft book on applied program evaluation in Stata, an NSF-funded evaluation workshop, and a tool for building interactive SMCL help files and slides.

Code
Gallery

Ten of these tools, and what they produce

One screenshot from each of ten packages in the index above; each panel links to the source and, where there is one, a live demo.

1 / 10
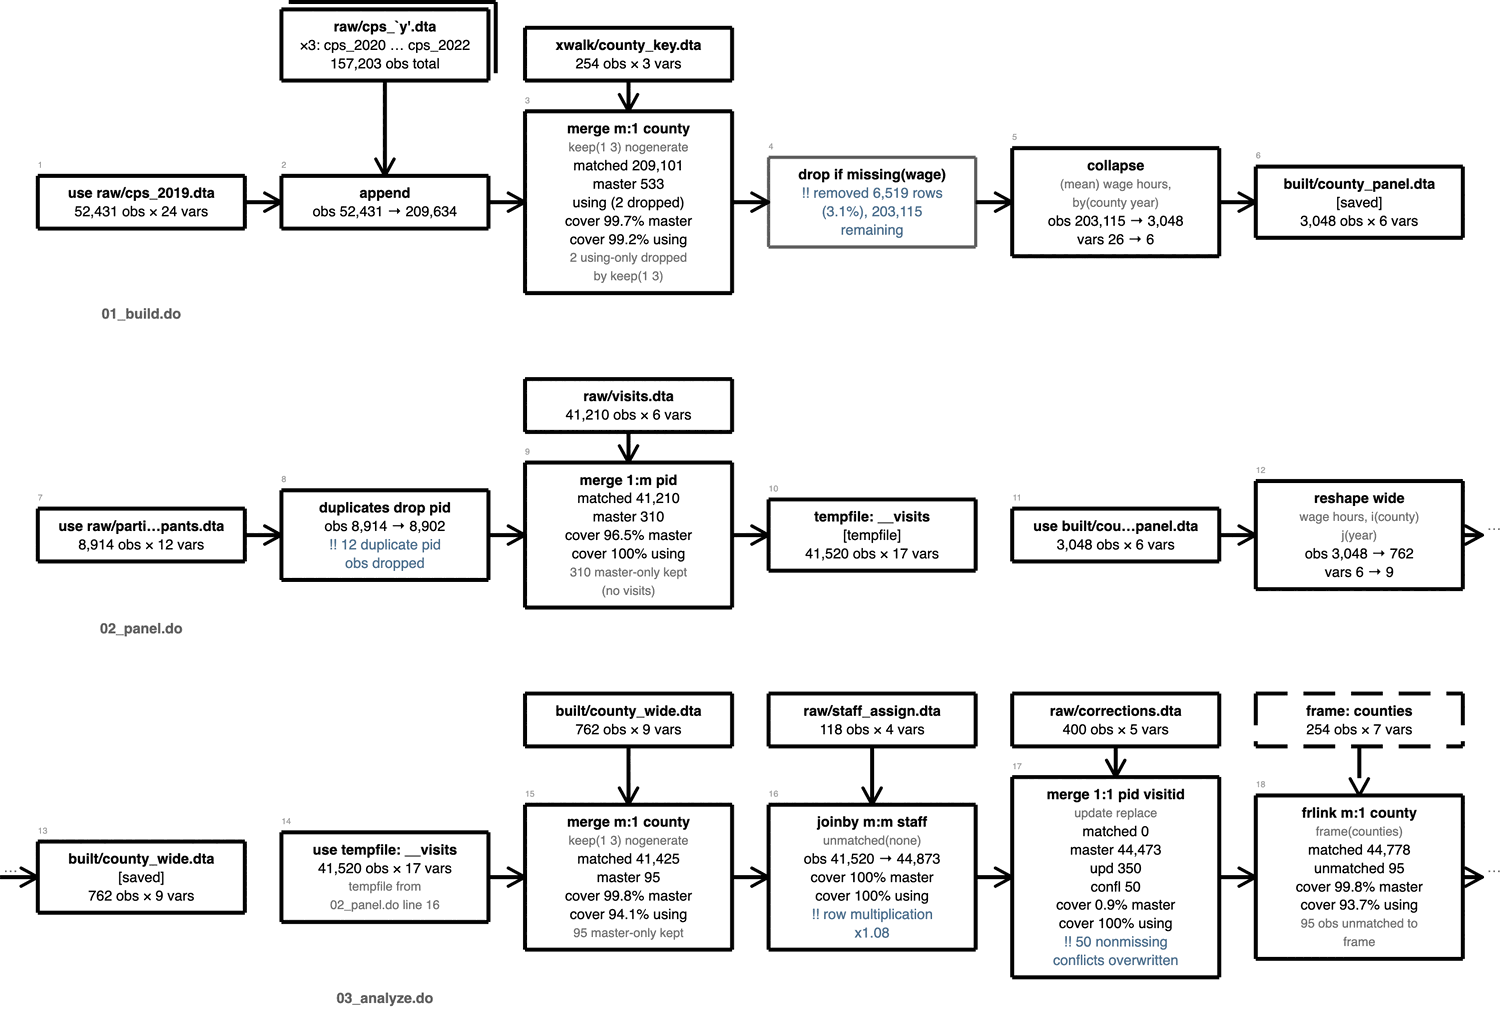
A mergemap run-mode diagram: two rows of boxes, one per do-file, tracing raw CPS files through an append, an m:1 county merge showing 209,101 matched and 99.7% master coverage, a drop that removed 6,519 rows, a collapse, and a saved county panel.
mergemap

What each join did to the row count

Run mode executes the do-files with instrumentation around every join, so the map reports what matched, what share of each side took part, and which step removed the rows.

Click the image for full size.
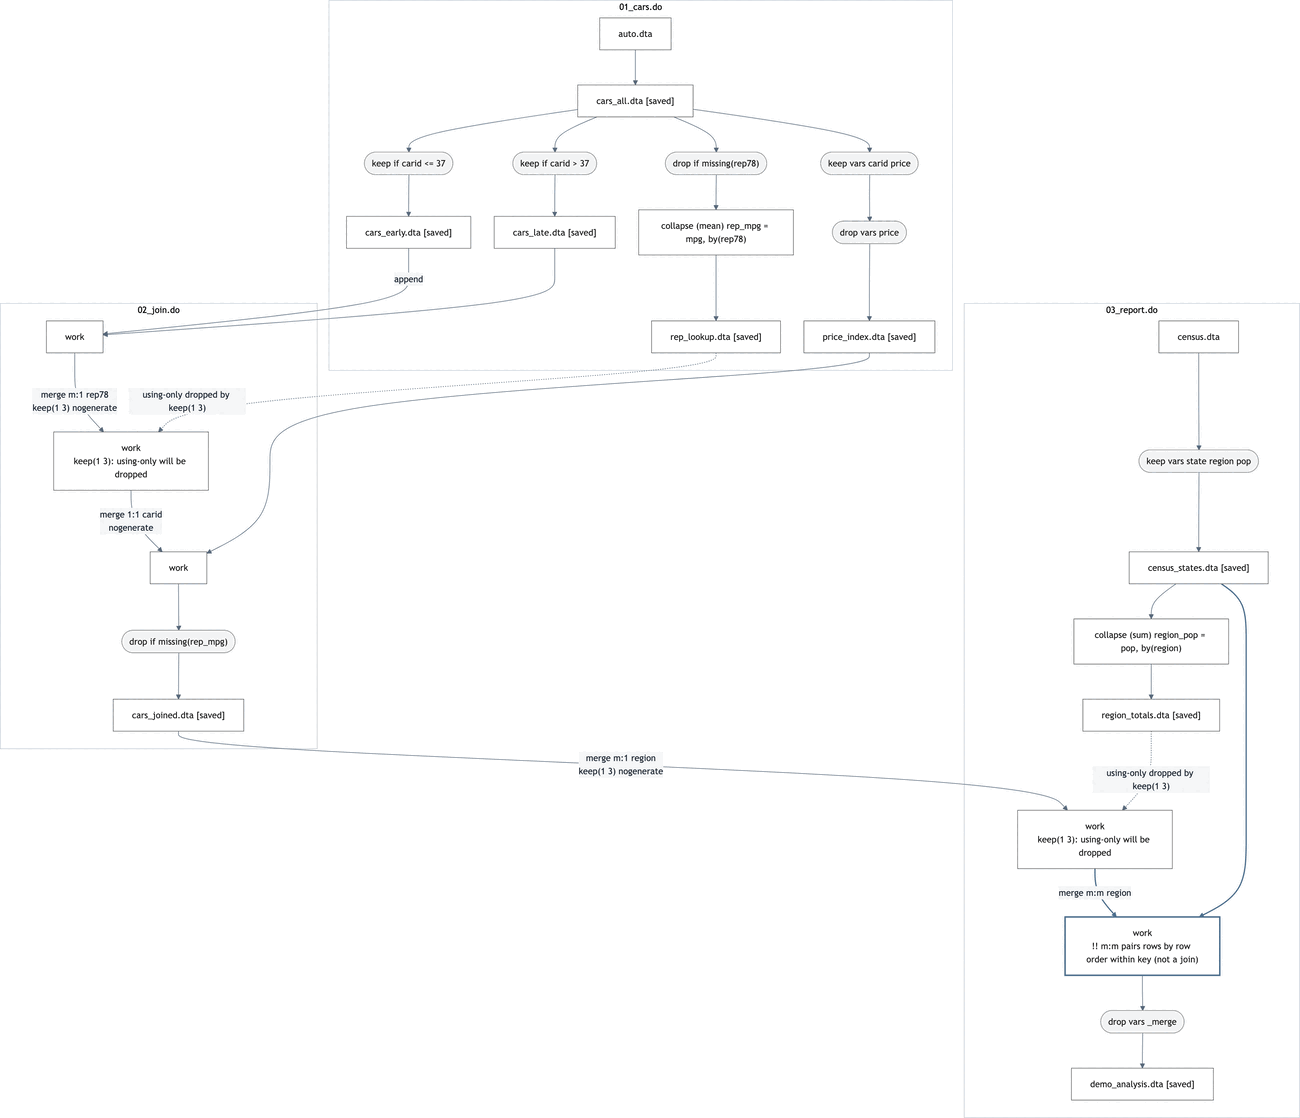
The same pipeline drawn by mermaid: three labelled subgraphs, one per do-file, with arrows crossing between them and a blue-outlined node flagging an m:m merge that pairs rows by order within key.
mergemap

The same map as mermaid text

draw, export(mermaid) writes plain text naming the boxes and arrows. Paste that text into a README, a wiki or Quarto, and those pages render the diagram from it; to update the picture, re-export the text.

Click the image for full size.
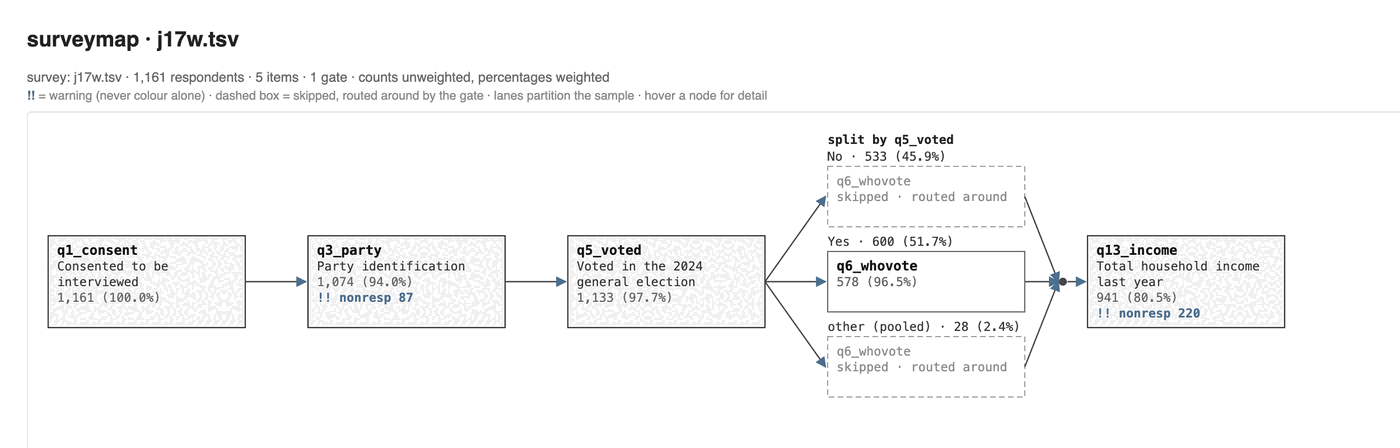
A surveymap flow map: consent, party and vote questions on a spine, then the sample splitting into three lanes at the vote question, where dashed grey boxes mark the vote-choice item that non-voters were routed around.
surveymap

Tell a refusal from a skip, item by item

A column that is 52% missing is either a question people refused or a question they were never shown. surveymap counts refusals and skips separately for every item, and draws the path through the questionnaire that the answers imply.

Click the image for full size.
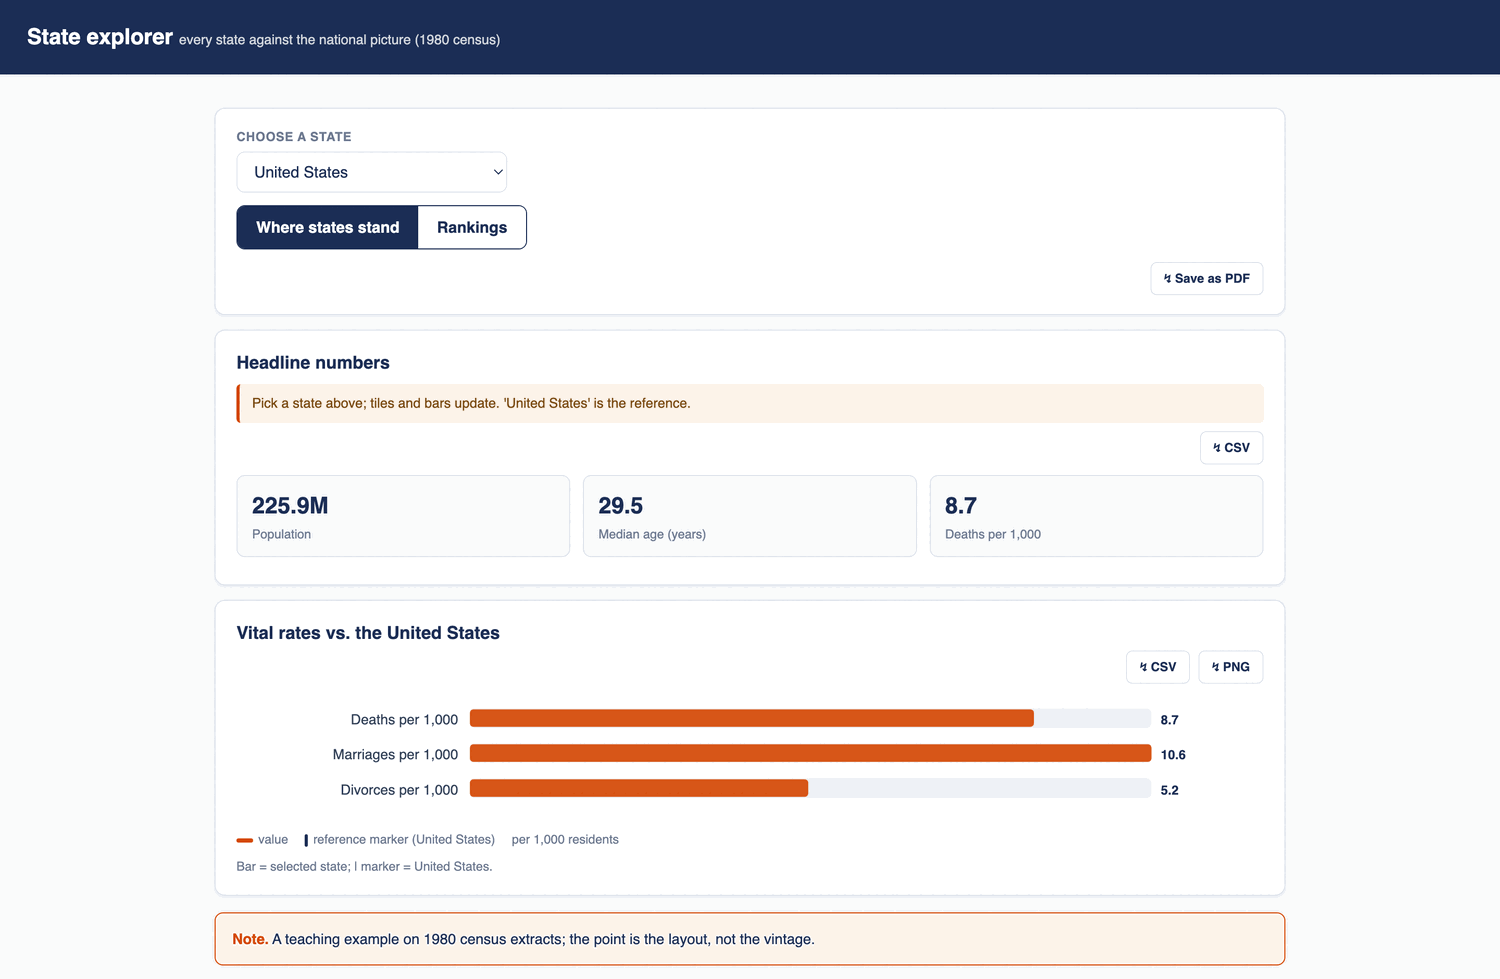
A dashboardbuilder dashboard titled State explorer: a choose-a-state dropdown, three KPI tiles for population, median age and deaths per thousand, and a bar panel comparing vital rates against a United States reference marker.
dashboardbuilder

A dashboard your reader can keep

Pick a state and every tile and bar updates for it, against a reference unit you choose. The build writes one HTML file that opens offline, with per-panel CSV and a save-as-PDF button.

Click the image for full size.
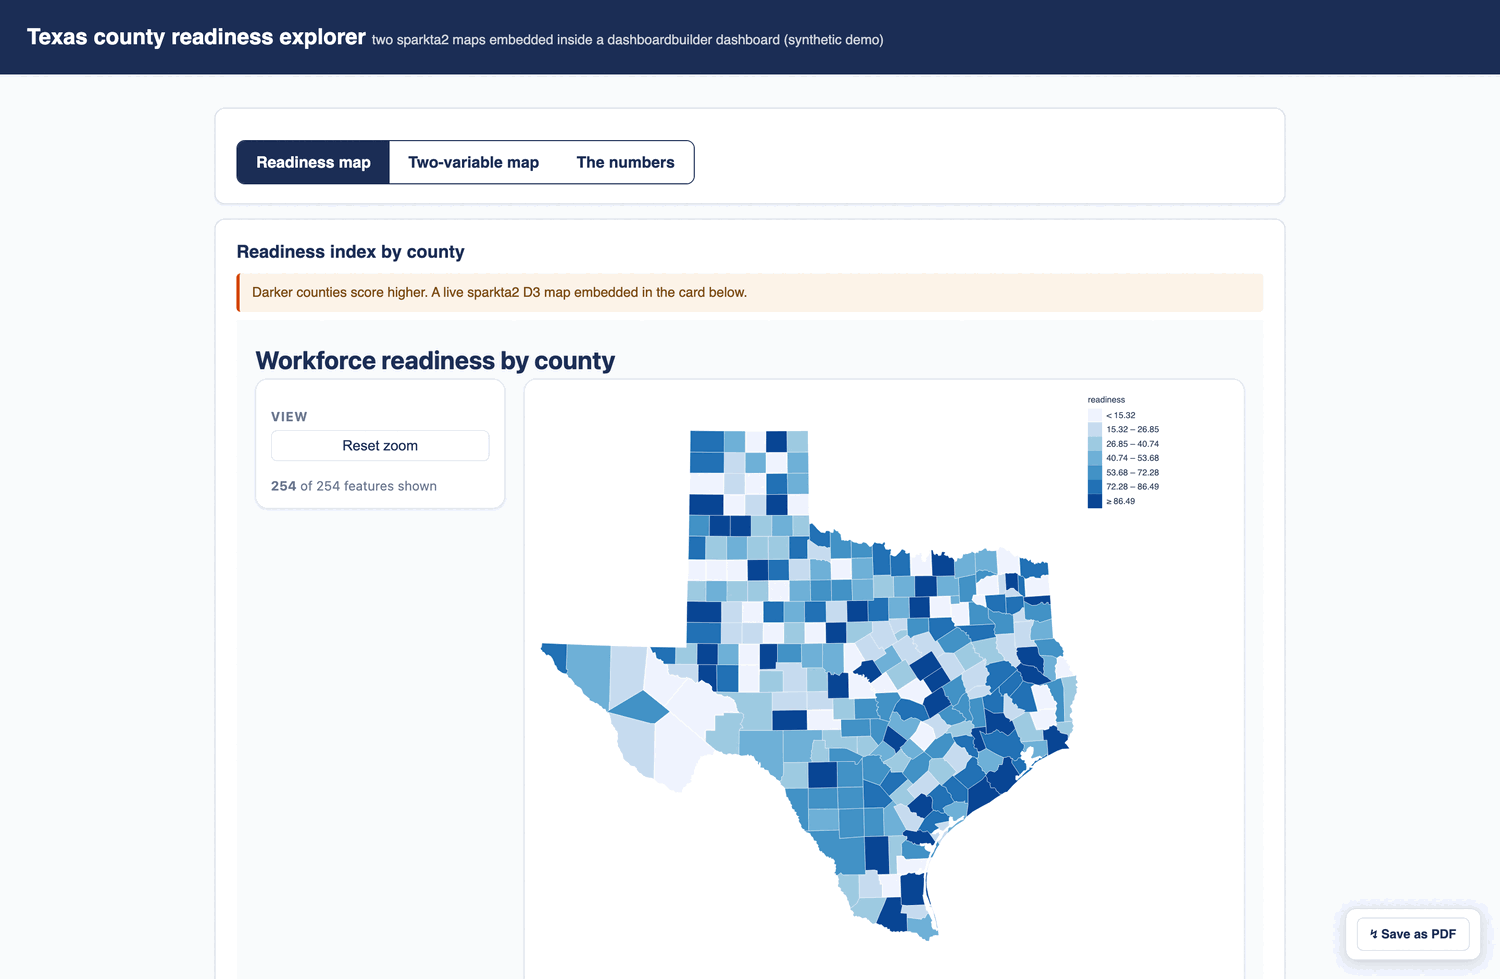
A Texas county readiness explorer: a blue choropleth of all 254 Texas counties with a readiness legend, a reset-zoom control and a feature count, embedded as a live panel inside a dashboard card.
sparkta2

254 Texas counties, mapped inside a dashboard panel

A sparkta2 choropleth embedded as a panel in a dashboardbuilder page, with Jenks breaks, hover detail, zoom and a reset control. A Texas 2036 tool.

Click the image for full size.
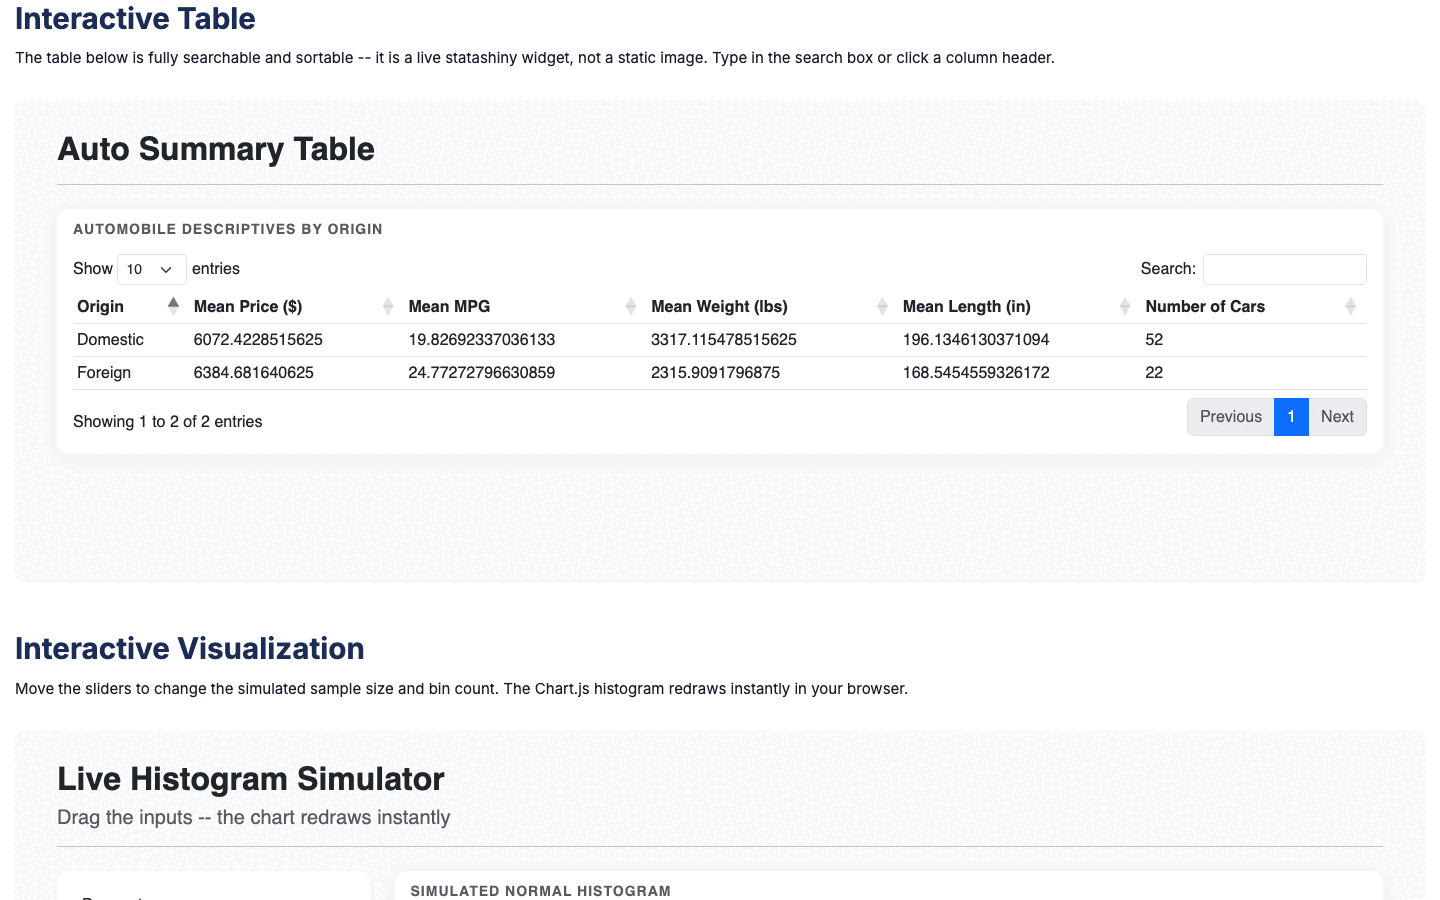
Two statashiny widgets: a searchable, sortable Auto Summary Table with a search box and column sort arrows, and below it a Live Histogram Simulator with sample-size and bin-count inputs.
statashiny

Widgets that recompute in the browser

A searchable, sortable table and a histogram that redraws as you move the inputs. You write Stata; statashiny writes the HTML, CSS and JavaScript into one file you can email.

Click the image for full size.
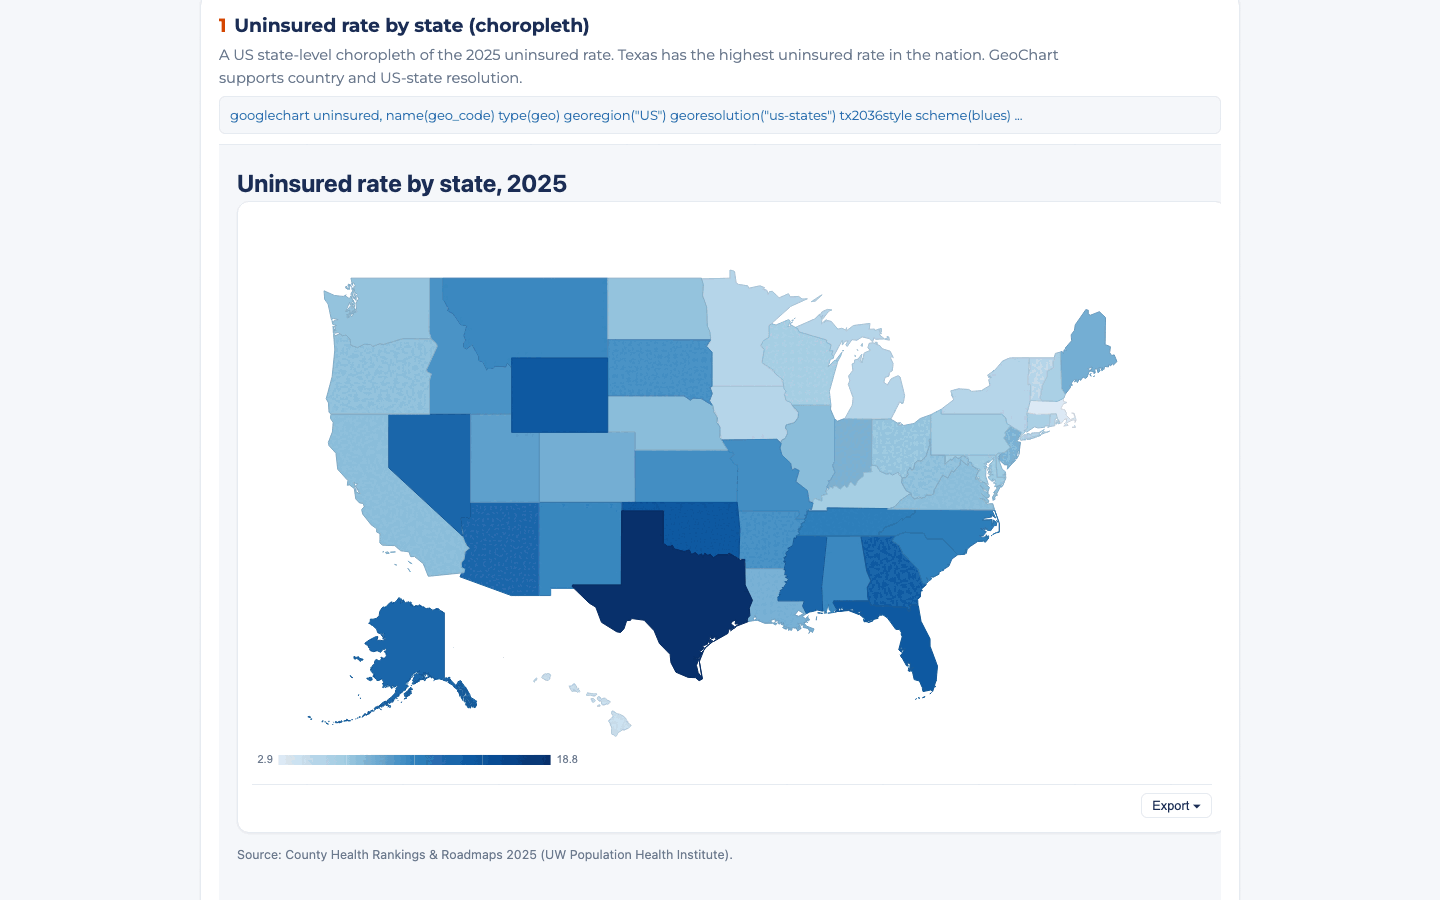
A Google Charts state choropleth titled Uninsured rate by state, 2025, shaded in blues with Texas darkest, a continuous legend along the bottom and an Export menu in the corner.
googlechart

Google Charts, written straight from a do-file

One Stata do-file wrote every chart on the demo page into a self-contained HTML file, tooltips and export menu included.

Click the image for full size.
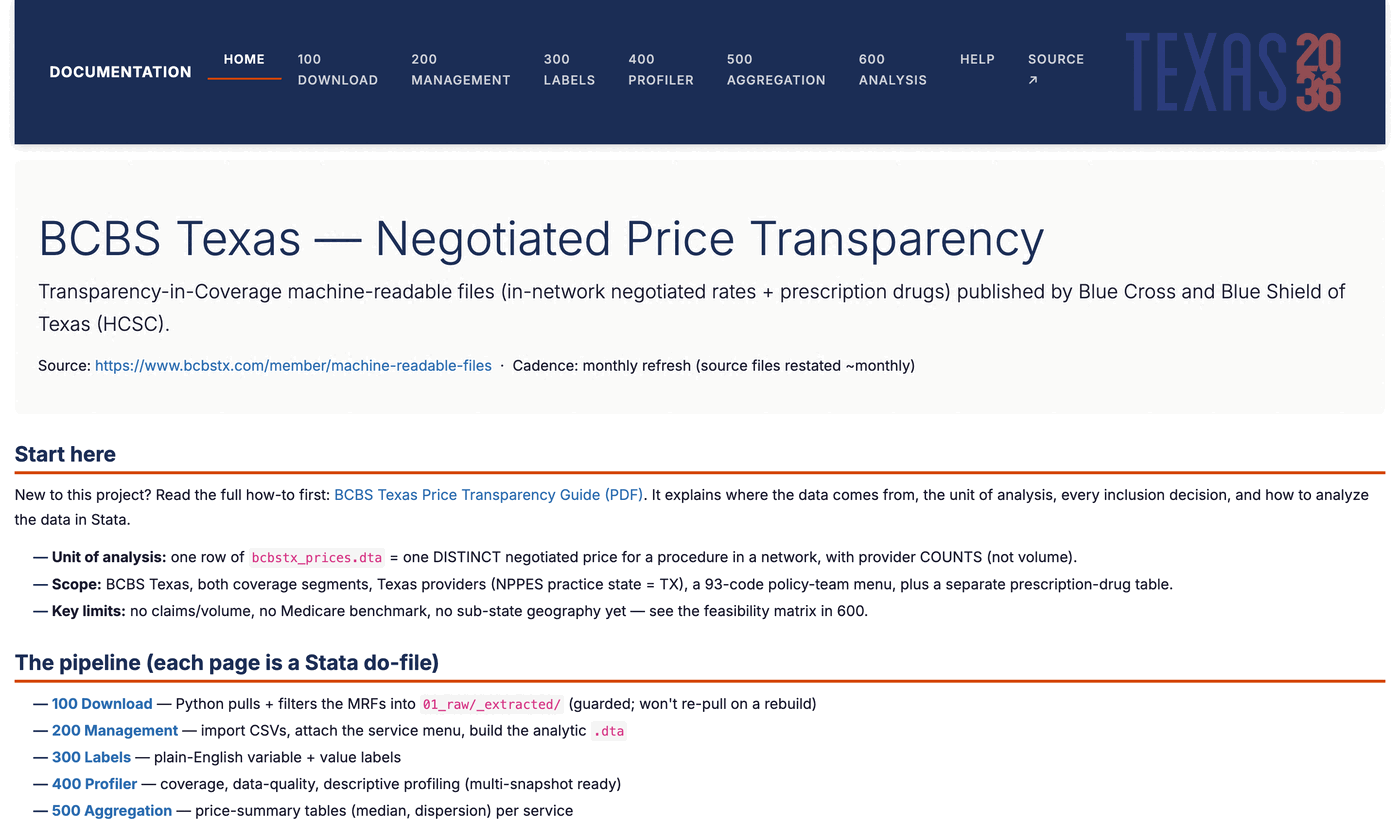
A webdoc2 report page for BCBS Texas negotiated price transparency: a navy navbar with numbered sections, a title, a Start here block, and a colour-coded list of the pipeline stages, each a Stata do-file.
webdoc2

The do-file that made the numbers also writes the page

You keep writing Stata, and short commands compile to Bootstrap 5 pages with a navbar, in-page contents, collapsible code panels, captioned figures and embedded dashboards.

Click the image for full size.
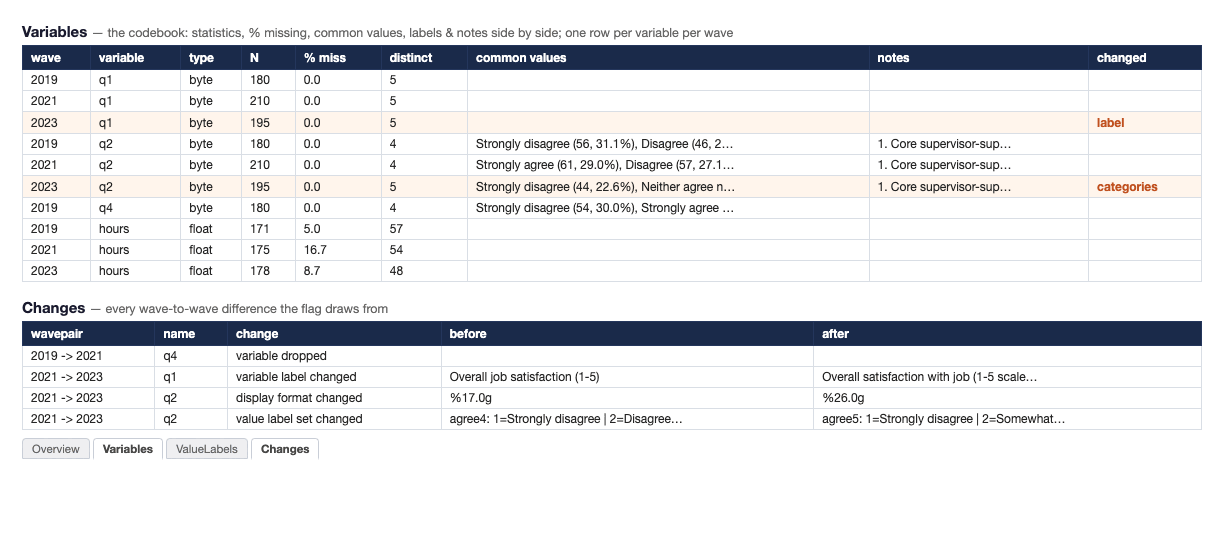
A datadictionary Excel codebook: a Variables sheet with one row per variable per wave showing type, N, percent missing, distinct count, common values and notes, and below it a Changes sheet naming each wave-to-wave difference.
datadictionary

One codebook across waves, every change listed

One row per variable per wave, with the statistics, labels, notes and value labels in adjacent columns, and a Changes sheet that lists every wave-to-wave difference behind the flags.

Click the image for full size.
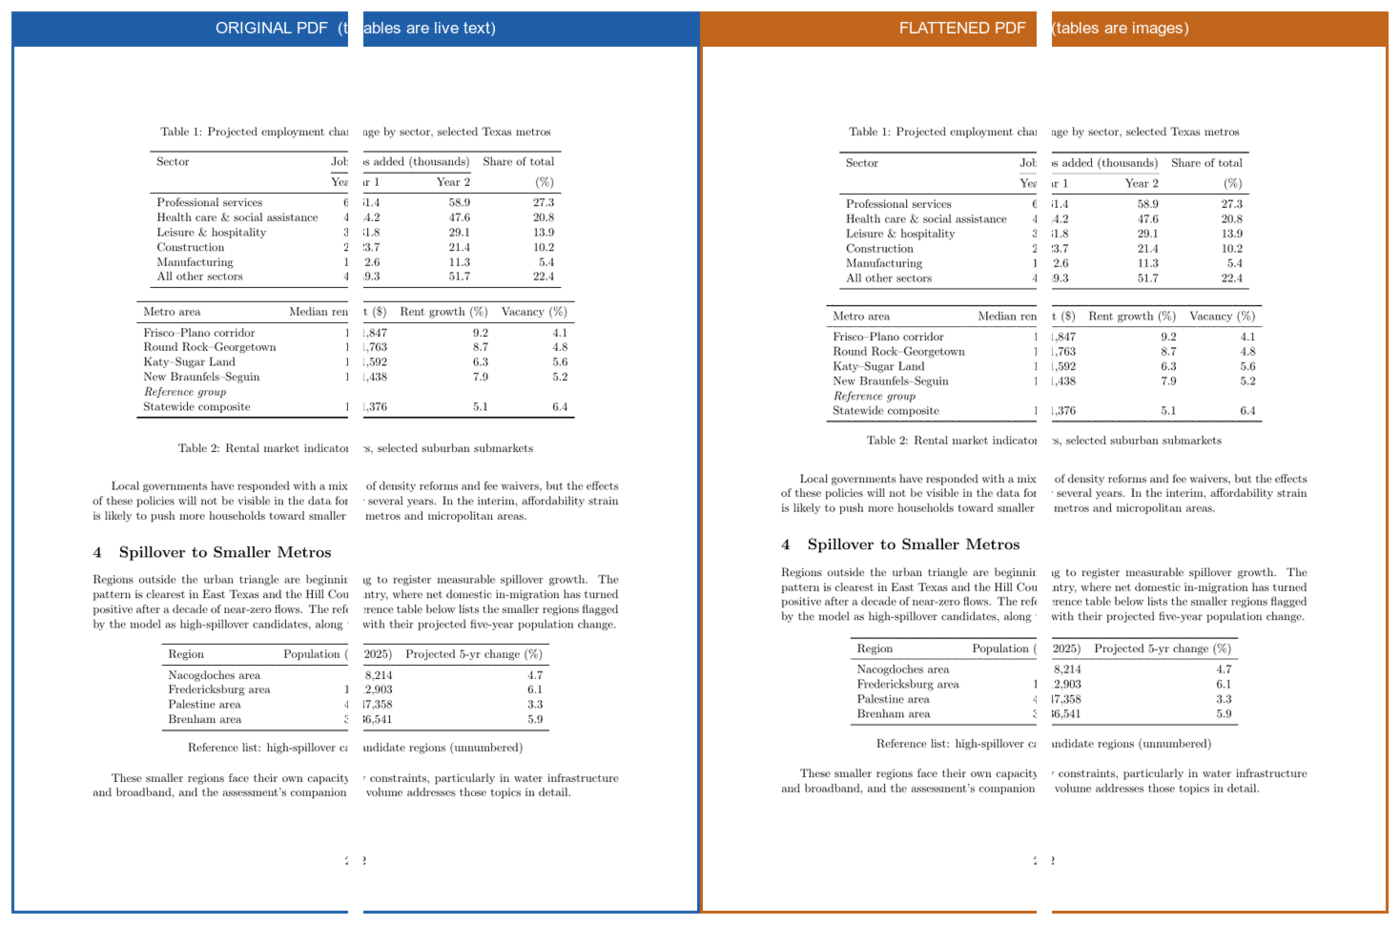
Two pages side by side: the original PDF with live-text tables on the left under a blue banner, and the flattened PDF with the same tables as images on the right under an orange banner, laid out identically.
tablepngs

LaTeX tables kept intact in Word

Each table becomes a high-resolution image, and the script then compiles the rewritten document and checks page by page that the layout still matches the original.

Click the image for full size.

Bonus — works in progress & local utilities

Fun experiments and personal Stata scripts that live in my adopath but aren't packaged on GitHub or SSC. Browse them in a shared Google Drive folder; in Stata, type which cmd to see any command's syntax.
More local utilities
  • cls — clears the Stata Results window; the logo option reprints the Stata banner.
  • cdropmiss — drops variables (or, with obs, observations) whose share of missing values passes a threshold.
  • edrop — an extended drop / keep that returns counts, can target temporary variables, and matches names exactly.
  • typeset — compiles a LaTeX .tex file to a PDF straight from Stata (macOS or Windows).
  • constants2chars — stashes constant-valued variables as dataset characteristics to slim a file down.
  • chars2constants — rebuilds those variables back from the stored characteristics (the companion to constants2chars).
No tools match that search — try a shorter term, or clear the box.

Source for everything is at github.com/ericabooth →; all my Stata modules are also on RePEc / SSC →. A SSC tag means the package installs with ssc install <name>. Longer walkthroughs are in the mergemap and surveymap galleries and on the sparkta2, dashboardbuilder, statashiny, googlechart and webdoc2 demo sites.