Coverage, data-quality, and descriptive profiling. Built to run on one snapshot now and on a stacked multi-month panel later (keyed on run_date).
. di as txt "Monthly snapshots (run_date) in this file : `nsnap'  (`snaps')"
Monthly snapshots (run_date) in this file : 1  (2026-05-30)

. di as txt "Distinct medical price rows               : `=_N'"
Distinct medical price rows               : 2097564
. di as txt "Networks                                  : `: word count `nn''"
Networks                                  : 11
. di as txt "Procedure codes present                   : `: word count `pc''"
Procedure codes present                   : 93

. di as txt "NOTE run_date is the snapshot key; file_vintage is the source file's"
NOTE run_date is the snapshot key; file_vintage is the source file's

. di as txt "     production date (provenance only — it varies within one pull)."
     production date (provenance only — it varies within one pull).
Which of the policy team's 93 menu codes showed up this run. Missing codes are listed explicitly — they are NOT analyzable until a future run includes them.
. count if _merge==3
  93

. di as txt "Menu codes FOUND in data : `r(N)'"
Menu codes FOUND in data : 93

. count if _merge==2
  0

. di as err "Menu codes NOT found     : `r(N)'  (cannot be analyzed this run)"
Menu codes NOT found     : 0  (cannot be analyzed this run)

. list procedure_code short_label if _merge==2, noobs sep(0) abbreviate(28)
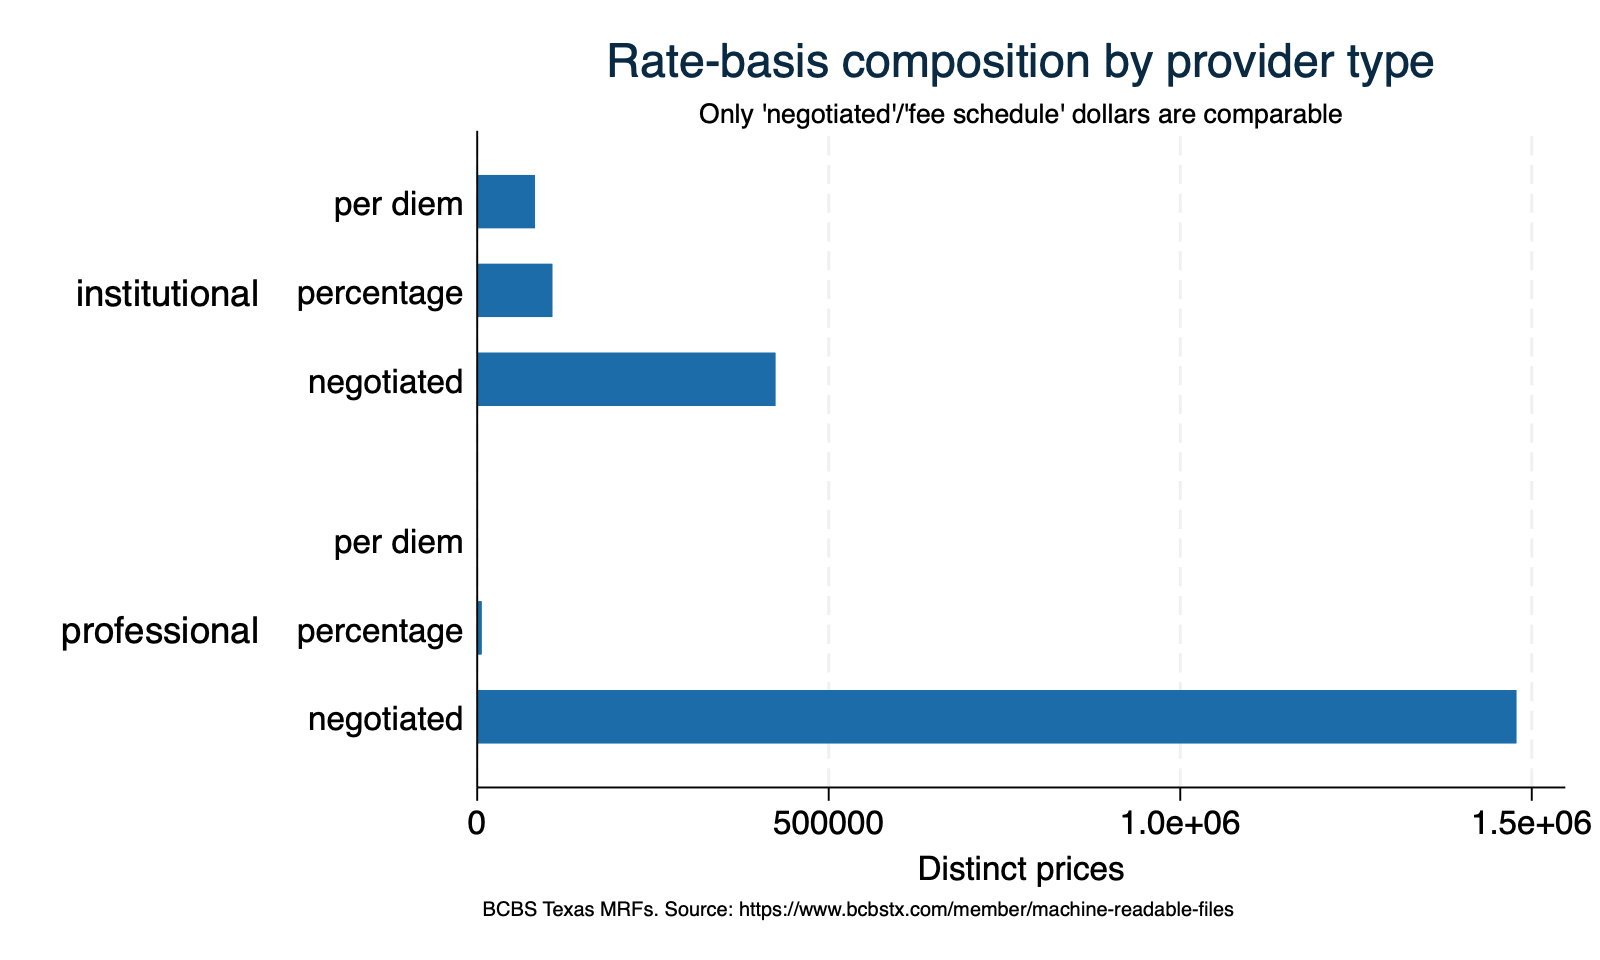
The payer-MRF analogue of Texas 2036's hospital-file methodology audit. Only fee-for-service, dollar-denominated rates are comparable as unit prices; percentage-of-charge and per-diem are kept but flagged out of dollar comparisons.
. tabulate rate_basis provider_type, row

+----------------+
| Key            |
|----------------|
|   frequency    |
| row percentage |
+----------------+

    How to |
      read |
    amount |
(negotiate |
   d$, fee |
 schedule, |     Professional
percentage |     (clinician) /
     , per |     institutional
     diem, |   (facility) / both
  derived) | institu..  profess.. |     Total
-----------+----------------------+----------
negotiated |   424,155  1,478,055 | 1,902,210
           |     22.30      77.70 |    100.00
-----------+----------------------+----------
  per diem |    82,269          0 |    82,269
           |    100.00       0.00 |    100.00
-----------+----------------------+----------
percentage |   106,850      6,235 |   113,085
           |     94.49       5.51 |    100.00
-----------+----------------------+----------
     Total |   613,274  1,484,290 | 2,097,564
           |     29.24      70.76 |    100.00

. di as txt _n "Comparable dollar prices flag (dollar_ffs): 1 = ffs + negotiated/fee-schedule \$"

Comparable dollar prices flag (dollar_ffs): 1 = ffs + negotiated/fee-schedule $

. tab dollar_ffs

 Comparable |
 unit price |
     (ffs + |
     dollar |
   basis) — |
 filter for |
 $ analysis |      Freq.     Percent        Cum.
------------+-----------------------------------
       0 No |    195,354        9.31        9.31
      1 Yes |  1,902,210       90.69      100.00
------------+-----------------------------------
      Total |  2,097,564      100.00
. tabulate provider_type care_setting

 Professional |
(clinician) / |     Care setting
institutional |     (inpatient /
 (facility) / |  outpatient / both)
         both | inpatient  outpati.. |     Total
--------------+----------------------+----------
institutional |   283,321    329,953 |   613,274
 professional |         0  1,484,290 | 1,484,290
--------------+----------------------+----------
        Total |   283,321  1,814,243 | 2,097,564
IMPORTANT data limitation. In the BCBSTX professional file one negotiated price applies to a SET of place-of-service codes (e.g., "11;17;20;50;72;81"), not one POS. So an office (POS 11) vs hospital-outpatient (POS 22) "site-neutral" comparison is NOT separable within this payer's professional rates. The feasible site-of-care lens is PROFESSIONAL (physician) vs INSTITUTIONAL (facility) — done in 600.
. count if provider_type=="professional" & strpos(place_of_service,";")>0
  1,484,290

. di as txt "Professional rows whose price spans MULTIPLE POS codes: `r(N)'"
Professional rows whose price spans MULTIPLE POS codes: 1484290
. count if provider_type=="professional" & pos_has11 & pos_has22
  380,056

. di as txt "Professional prices covering BOTH office (POS 11) and HOPD (POS 22) in one row: `r(N)'"
Professional prices covering BOTH office (POS 11) and HOPD (POS 22) in one row: 380056

. di as txt "  -> confirms one rate, many settings (POS is not a price lever in this file)."
  -> confirms one rate, many settings (POS is not a price lever in this file).
. di as txt "Comparable dollar prices: `=_N'"
Comparable dollar prices: 1902210

. summarize negotiated_amount, detail

            Negotiated price (US$; a percent when
                   rate_basis=percentage)
-------------------------------------------------------------
      Percentiles      Smallest
 1%            0              0
 5%            0              0
10%            5              0       Obs           1,902,210
25%        40.85              0       Sum of wgt.   1,902,210

50%       104.03                      Mean           714.5966
                        Largest       Std. dev.      3345.016
75%       303.86       271524.4
90%      1108.24       271524.4       Variance       1.12e+07
95%      2180.96       271524.4       Skewness       15.37108
99%     13945.08       271524.4       Kurtosis       478.5721

. count if negotiated_amount<=0
  173,940

. di as err "  prices <= \$0 (suspect / placeholder): `r(N)'"
  prices <= $0 (suspect / placeholder): 173940

. count if negotiated_amount>200000
  9

. di as txt "  prices > \$200,000 (verify; plausible for some inpatient DRGs): `r(N)'"
  prices > $200,000 (verify; plausible for some inpatient DRGs): 9
Median, p10, p90 of the comparable dollar price by service category and provider type — the category-level orientation before the service-level deep dives in 600.
. di as txt "Median, p10, p90 of the comparable dollar price, by service category and provider type:"
Median, p10, p90 of the comparable dollar price, by service category and provider type:

. list service_category provider_type median p10 p90 n, noobs sep(0) abbreviate(24)

  +-------------------------------------------------------------------------+
  |     service_category   provider_type   median     p10      p90        n |
  |-------------------------------------------------------------------------|
  |           Cardiology   institutional       75      11      419     6985 |
  |           Cardiology    professional       67      12      241    39462 |
  |       E&M outpatient   institutional      106      26      405    25310 |
  |       E&M outpatient    professional       82      35      164   304161 |
  |            Emergency   institutional      384     105    2,580    17632 |
  |            Emergency    professional       65      10      155    81226 |
  |              Imaging   institutional      256      69    1,146    35027 |
  |              Imaging    professional       85      27      270   260218 |
  |        Inpatient DRG   institutional        0       0    9,750   137422 |
  |    Inpatient surgery   institutional    6,219   1,628   22,572    33428 |
  |    Inpatient surgery    professional    1,058     430    2,036    97848 |
  |                  Lab   institutional       13       4       60    38729 |
  |                  Lab    professional        6       4       29    70246 |
  |            Maternity   institutional      971      93    5,077    23687 |
  |            Maternity    professional      354      37    1,926   182952 |
  |        Maternity DRG   institutional        0       0    6,174    41044 |
  | Outpatient procedure   institutional      805       0    2,899    50626 |
  | Outpatient procedure    professional      215      44      567   264265 |
  |           Preventive   institutional      488     134    1,558    14265 |
  |           Preventive    professional      108      69      276   177677 |
  +-------------------------------------------------------------------------+
The static tables above answer fixed questions; this widget lets you ask your own. Built with the team's sparkta, it charts the median comparable price by care setting (inpatient vs outpatient) — a dimension the tables do not split — and re-draws live as you filter by code system (CPT / HCPCS / MS-DRG), provider type, and service category. Why run it: a fast way to PROFILE whether the data behaves sensibly across structural dimensions we filter on but rarely chart — inpatient prices should dwarf outpatient, and MS-DRG (whole-stay) prices should dwarf CPT line items — so an analyst can sanity-check the extract and spot a slice worth a closer look. The collapsible stats panel (N, median, spread) updates with every filter. (Representative ~40k-row sample of the comparable prices so the page stays light; the full data is in 02_cleaned/.)
These activate automatically once >=2 monthly pulls are stacked (append future runs, then re-run). With a single snapshot they are intentionally skipped.
Each price is tagged with the Texas Public Health Region of its provider group (the modal region of the group Texas NPIs — see 600 section 6). A blank region means the provider is registered out of state, the ZIP did not map, or the group is TIN-only with no resolvable NPI.
. tab has_region

 has_region |      Freq.     Percent        Cum.
------------+-----------------------------------
          0 |     15,186        0.72        0.72
          1 |  2,082,378       99.28      100.00
------------+-----------------------------------
      Total |  2,097,564      100.00

. tab region if region!=""

     region |      Freq.     Percent        Cum.
------------+-----------------------------------
          1 |    179,063        8.60        8.60
         11 |    142,595        6.85       15.45
        2/3 |    500,879       24.05       39.50
       4/5N |    255,055       12.25       51.75
       6/5S |    290,795       13.96       65.71
          7 |    293,113       14.08       79.79
          8 |    253,967       12.20       91.98
       9/10 |    166,911        8.02      100.00
------------+-----------------------------------
      Total |  2,082,378      100.00
Two former gaps are now CLOSED in this run — percent of Medicare (600, section 5) and Public Health Region geography (600, section 6). The following remain not possible with the current data: