Price-variation analyses for shoppable services, in the Texas 2036 framing. Descriptive of negotiated prices (not utilization or spending). All dollar figures restricted to comparable fee-for-service rates.
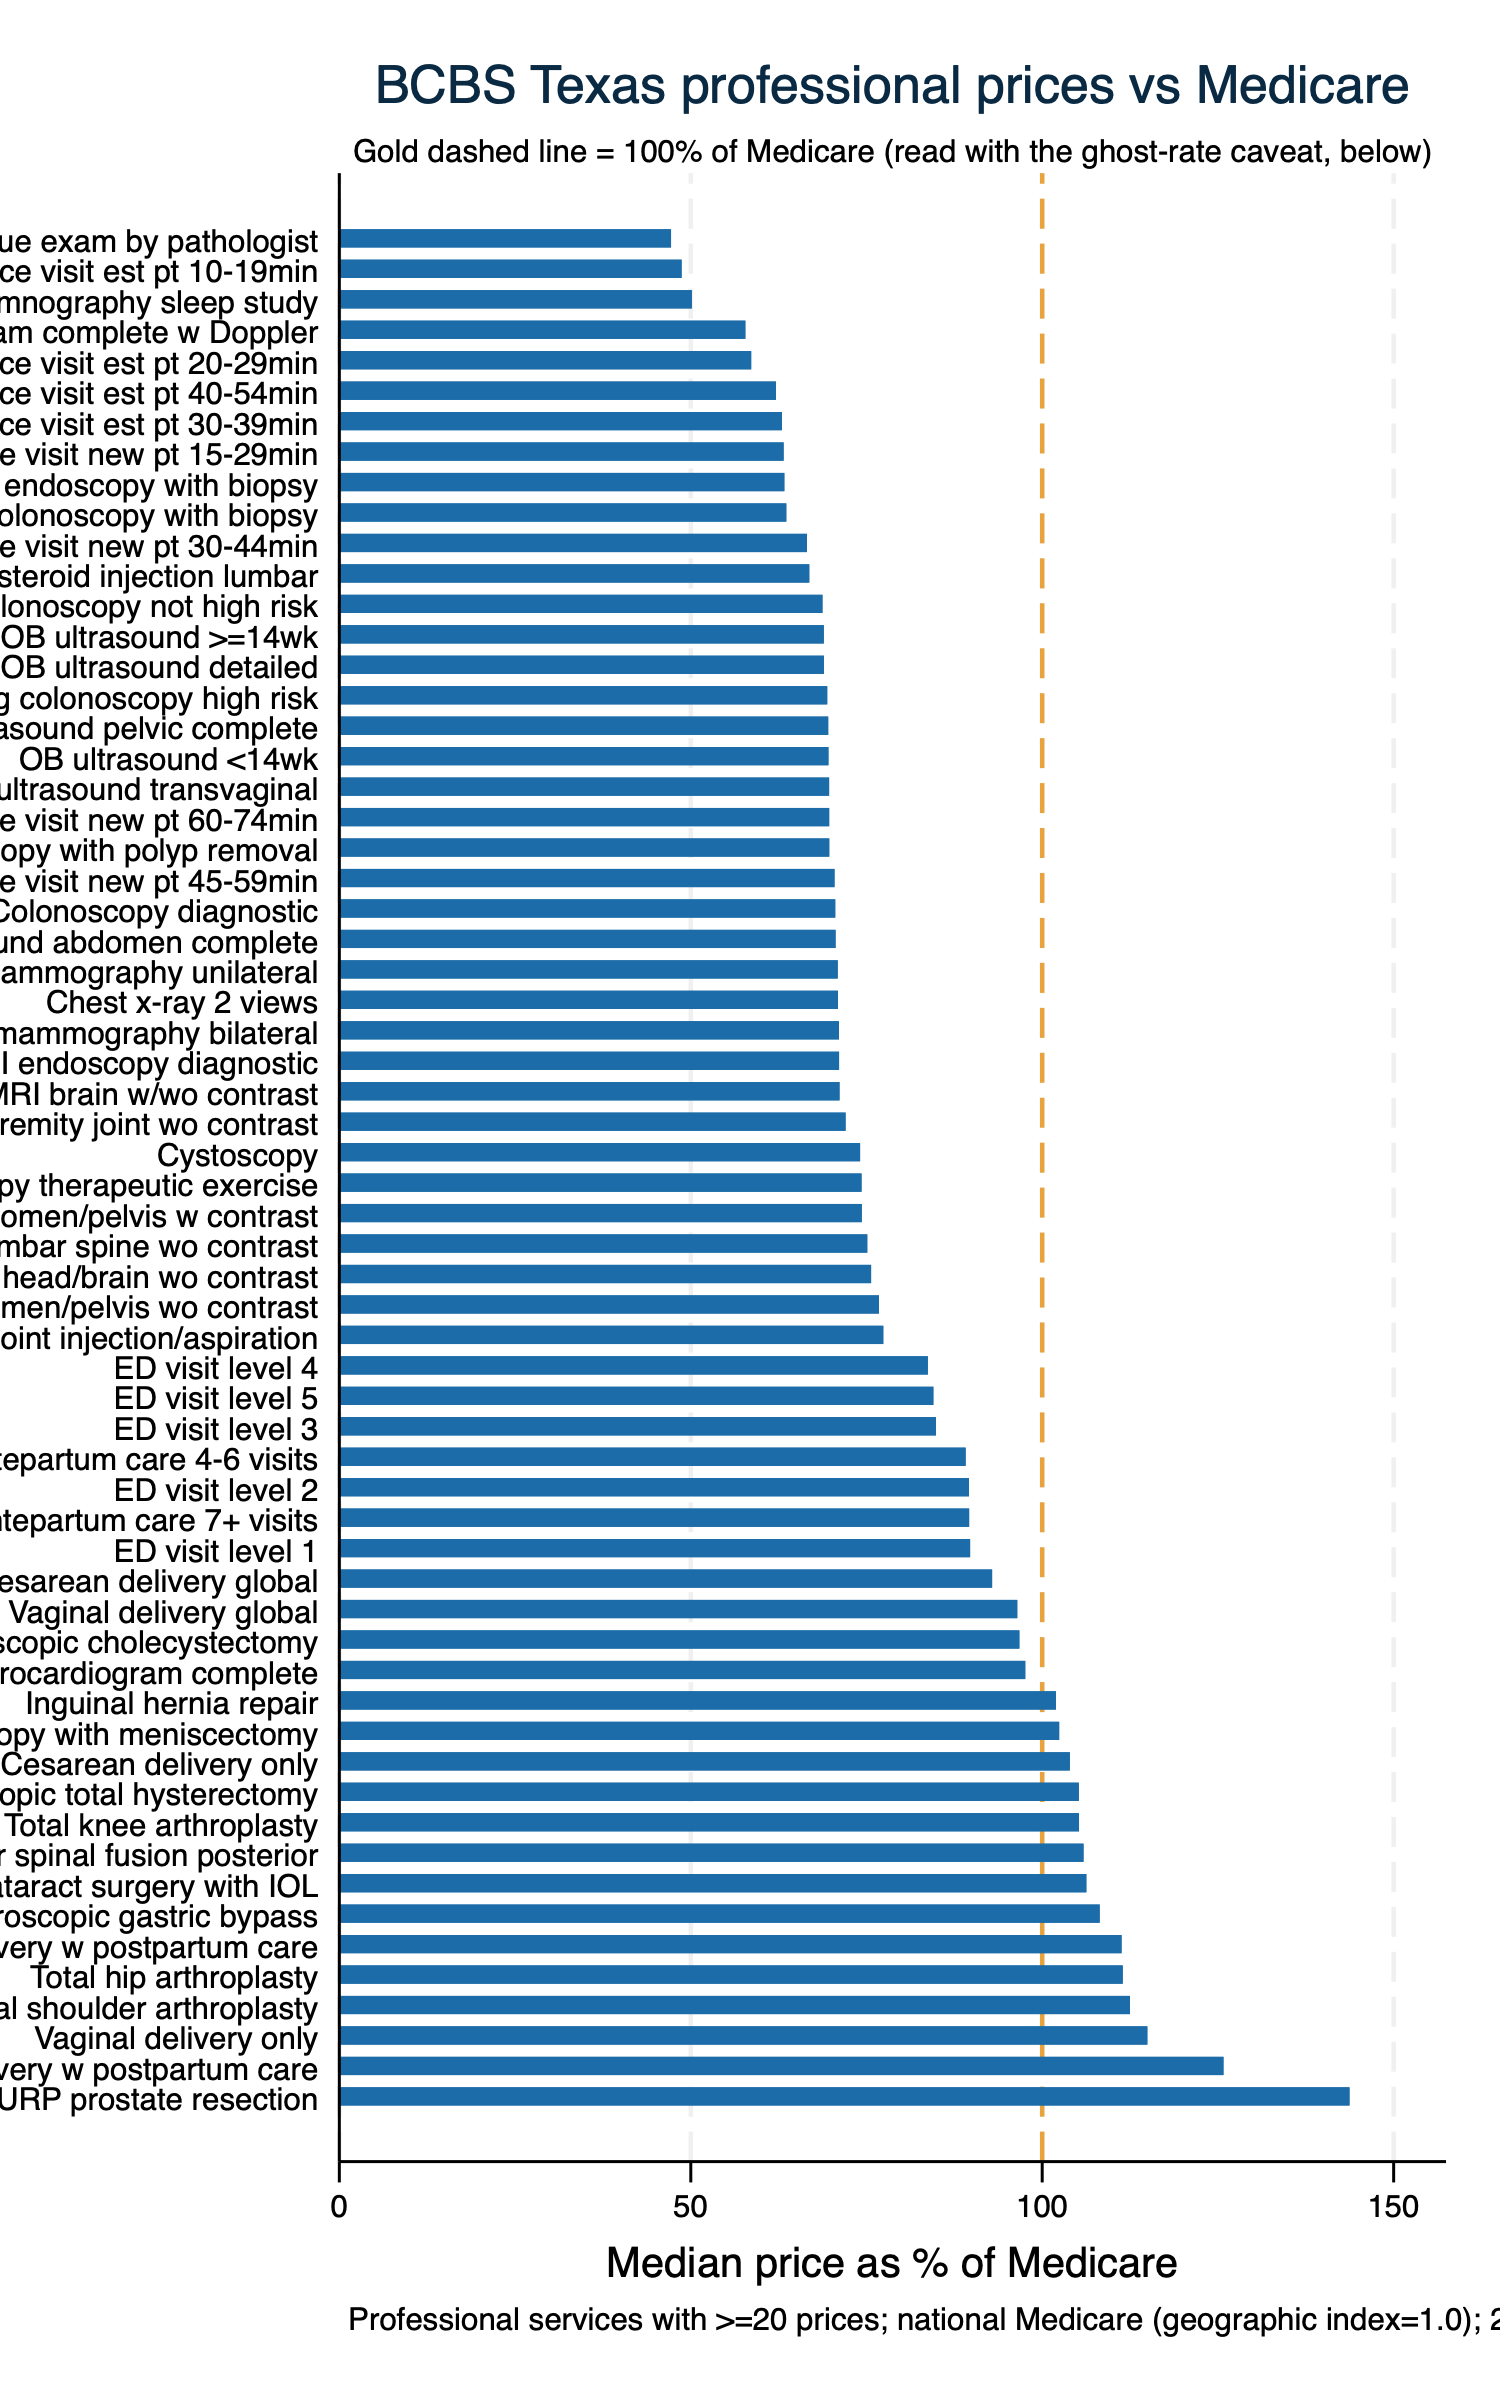
Insurers must publish a negotiated price for EVERY provider-and-service pair in their contracts — including pairs that essentially never happen. Example: a pediatric clinic with a listed price for a hip replacement, or a low placeholder rate a provider would never actually bill. These are called ghost rates (sometimes "zombie rates"). They are not data errors — they are genuine contract terms — but no patient is treated at them. Peer-reviewed work estimates that 70-92% of all the prices in these files are ghost rates. Because there are so many, they distort simple averages and medians (often a mass of low placeholder values drags the figure down). We cannot flag them precisely without claims/utilization data, so throughout this file we (1) report the MEDIAN rather than the mean (more robust to these outliers), (2) keep only comparable fee-for-service dollar rates, and (3) describe results as prices that are PUBLISHED, not prices actually PAID. Keep this in mind reading section 5: the finding that professional rates often sit below Medicare is partly a ghost-rate effect — the professional files carry many low, never-billed listings that pull the median down.
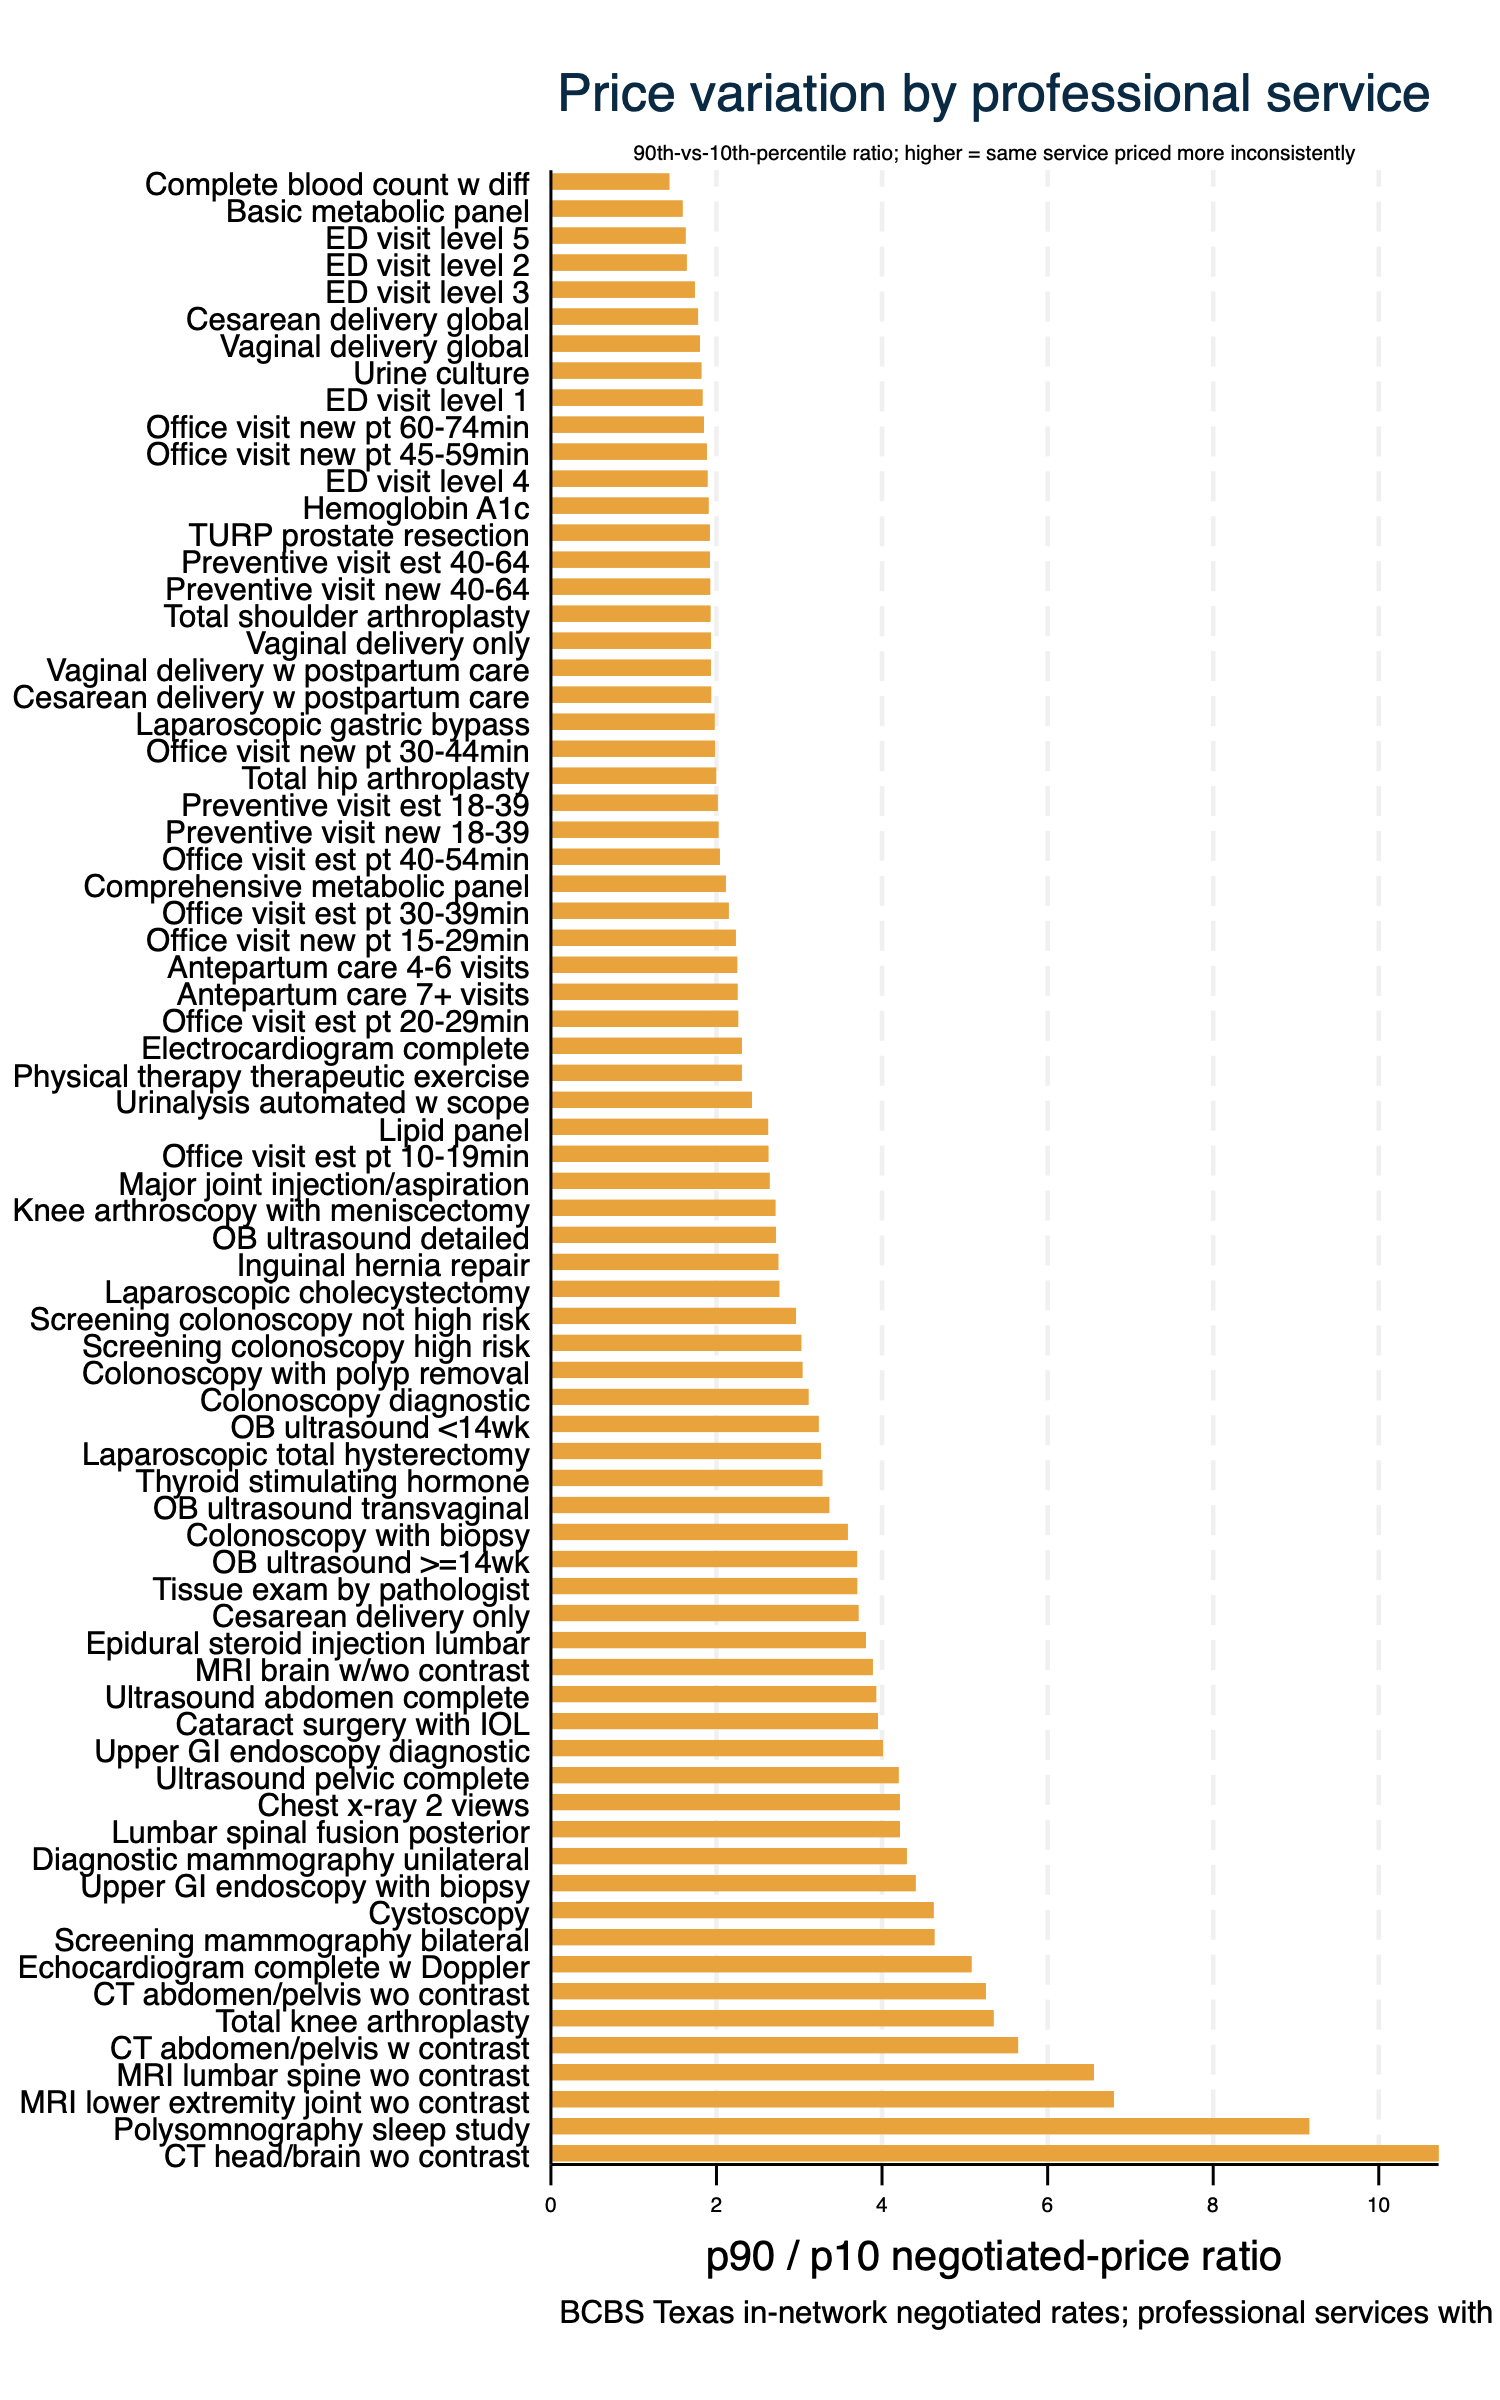
For each professional service with enough distinct prices, the p90/p10 ratio — how many times more the 90th-percentile price is than the 10th. This is the foundational Texas 2036 message: identical, shoppable services carry wildly different negotiated prices.
.     list service_label p50 p10 p90 p9010 n in 1/`=min(_N,20)', noobs sep(0) abbreviate(26)

  +--------------------------------------------------------------------------------------+
  |                         service_label       p50     p10       p90      p9010       n |
  |--------------------------------------------------------------------------------------|
  |             CT head/brain wo contrast     80.61   30.46     326.6   10.72226   24258 |
  |           Polysomnography sleep study    337.83   94.28    863.57   9.159631   27628 |
  | MRI lower extremity joint wo contrast    147.22   48.48    329.64   6.799505   22939 |
  |          MRI lumbar spine wo contrast       144   53.05     347.9   6.557964   25938 |
  |          CT abdomen/pelvis w contrast    223.17   65.42     369.2   5.643534   24924 |
  |               Total knee arthroplasty   1220.05   369.2   1973.94   5.346533   12870 |
  |         CT abdomen/pelvis wo contrast    140.53   62.18     326.6   5.252493   24136 |
  |     Echocardiogram complete w Doppler    113.65   54.69    277.84   5.080271   25744 |
  |       Screening mammography bilateral     89.74   27.25    126.24    4.63266   23751 |
  |                            Cystoscopy    159.87   64.94    300.22   4.623037   20271 |
  |        Upper GI endoscopy with biopsy     265.2   111.4    490.78   4.405566   25929 |
  |     Diagnostic mammography unilateral     87.87   28.76    123.62   4.298331   21652 |
  |        Lumbar spinal fusion posterior   1553.77   583.2   2459.27   4.216855   10973 |
  |                   Chest x-ray 2 views     23.46    7.86     33.12    4.21374   24191 |
  |            Ultrasound pelvic complete     73.18   24.59    103.27   4.199675   21815 |
  |         Upper GI endoscopy diagnostic    229.38   99.17     397.8   4.011294   23547 |
  |             Cataract surgery with IOL    491.64   209.1    826.02   3.950359   10694 |
  |           Ultrasound abdomen complete     80.64   28.93    113.67   3.929139   21911 |
  |               MRI brain w/wo contrast    225.57   82.15    319.36   3.887523   23537 |
  |     Epidural steroid injection lumbar     177.1   90.48    344.19   3.804045   22960 |
  +--------------------------------------------------------------------------------------+
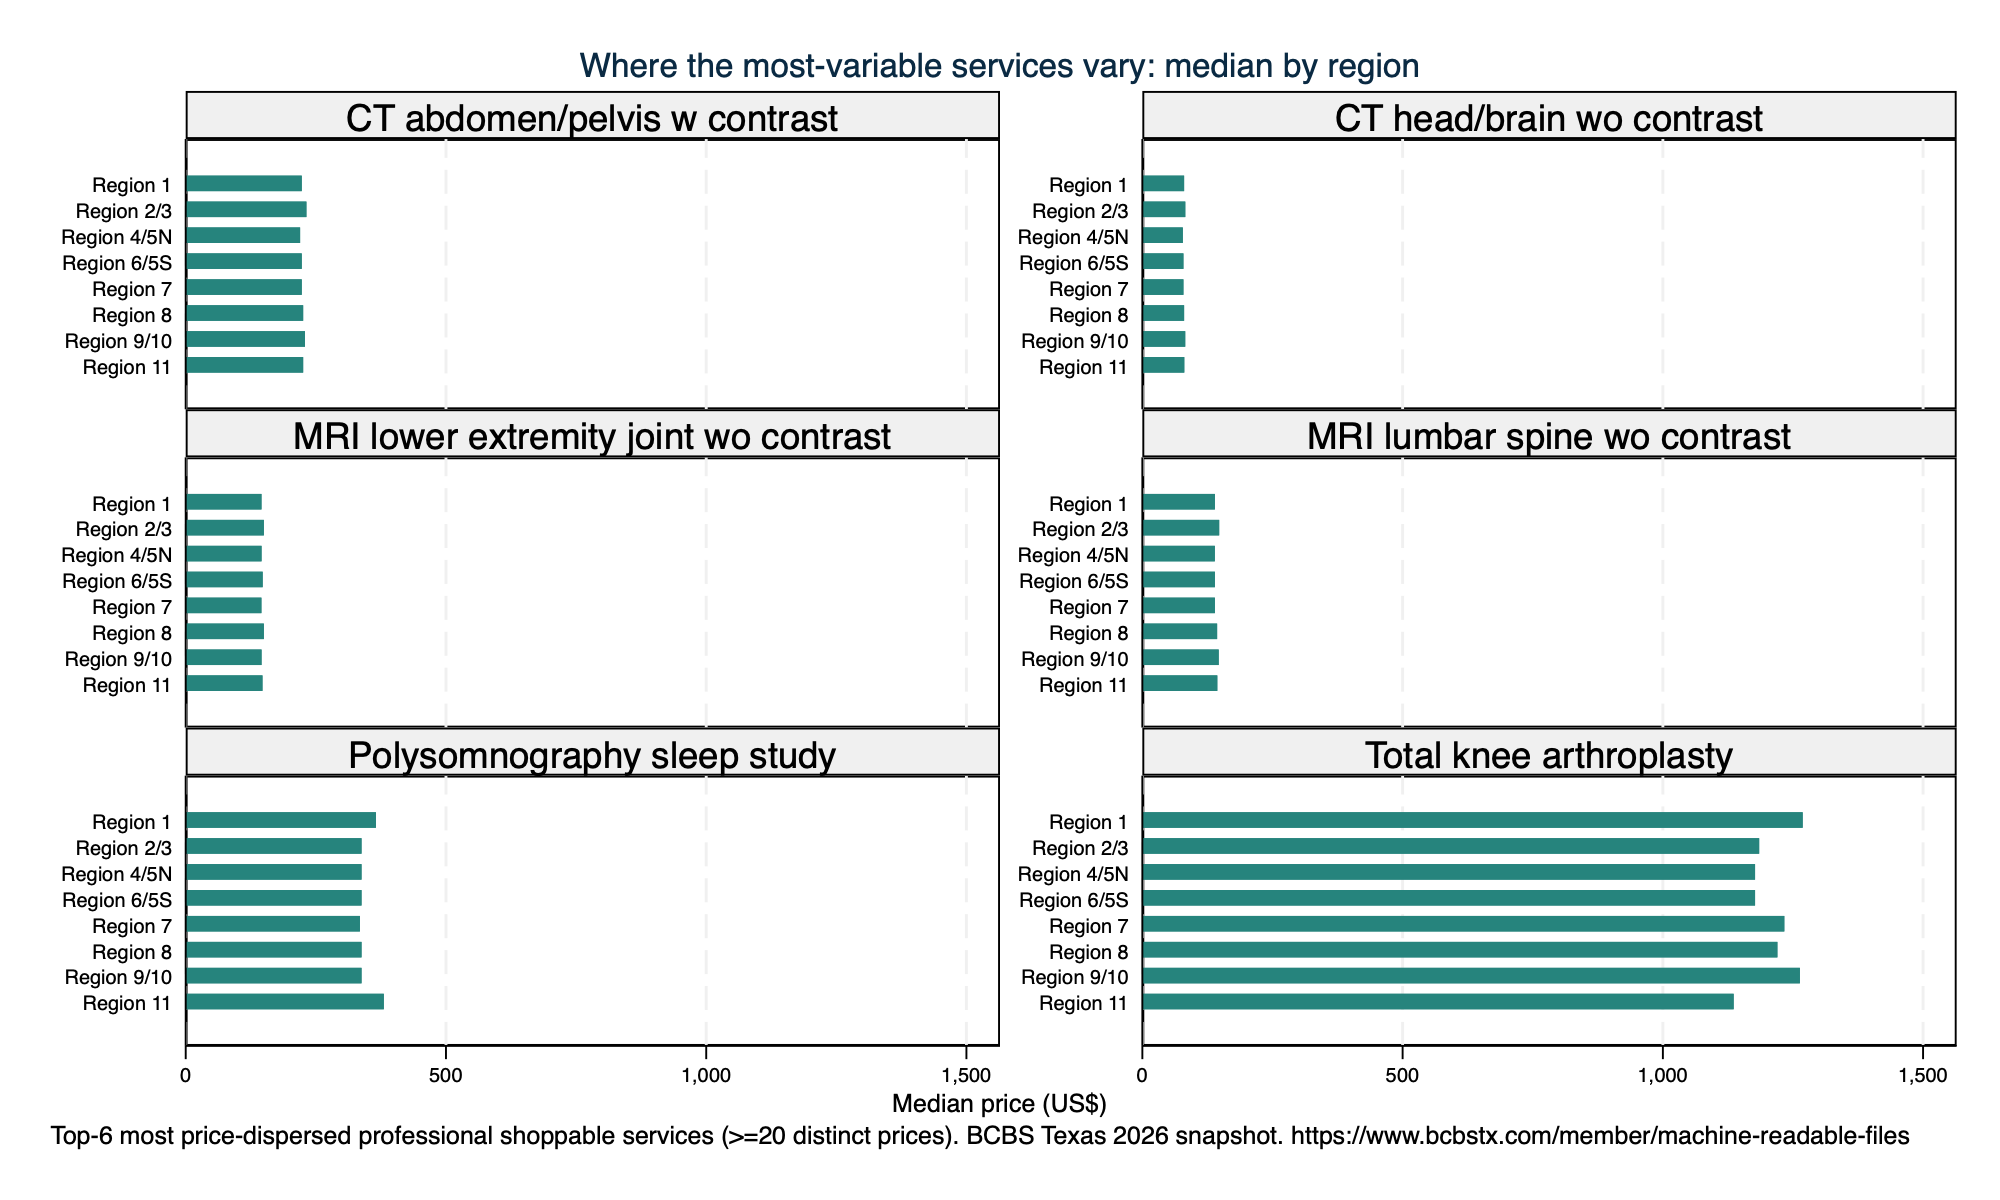
The ranking above shows WHICH services vary; this shows WHERE. For the six most price-dispersed professional services, each small panel is one service, with the median negotiated price in each of the 8 Public Health Regions. Bars of different lengths within a panel mean the same service is priced differently across Texas — a concrete map of where the dispersion lives.
The per-service price summary as a searchable, sortable table, built with the team's statashiny (Bootstrap 5 + DataTables) and embedded below. Click a column header to sort; type in the box to filter. Read every figure with the ghost-rate caveat (see the box above).
The ranking and the searchable table say WHICH services vary and WHAT they cost. This widget lets the policy team slice the comparable prices on demand: the bars show the median negotiated price by service category, and the dropdown filters re-draw it live for any combination of provider type (professional vs facility), BCBS Texas network, Public Health Region, and coverage segment (fully-insured / self-funded). Why run it: most follow-up questions in a briefing are '…but what about in MY region / network / segment?' — this answers them without a new Stata run, and the built-in stats panel (N, median, spread) updates with every filter. A range slider on the number of provider groups behind each price lets you focus on widely-shared prices — a rough way to down-weight rarely-used ghost rates. Example: pick Region 7 and compare imaging medians across networks, then slide up the minimum provider count. (On a representative ~40k-row sample of the comparable fee-for-service prices; full data in 02_cleaned/. Read with the ghost-rate caveat above.)
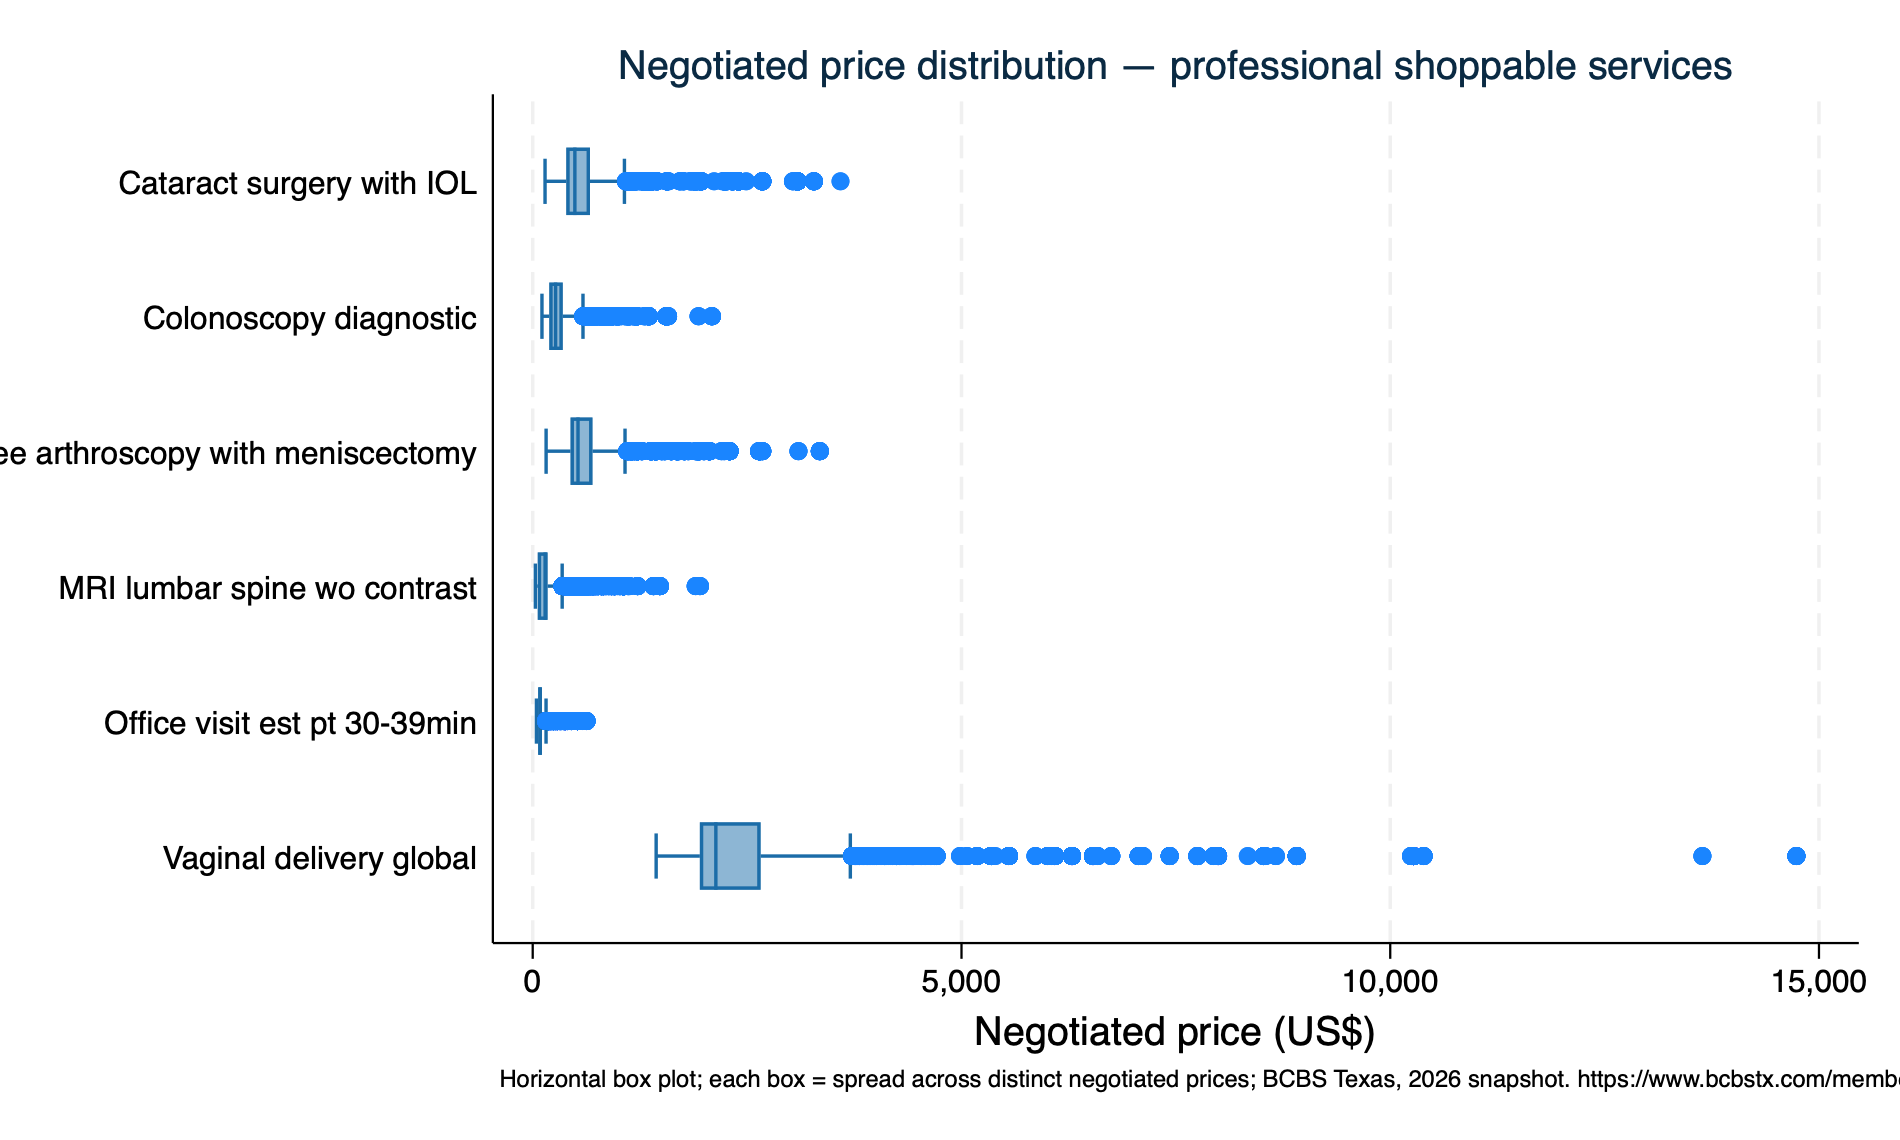
Distribution of negotiated prices for headline shoppable services, echoing Texas 2036's childbirth and knee-arthroscopy examples. Median with the min and max, then a box plot.
.     tabstat negotiated_amount, by(service_label) statistics(p50 min max n) format(%9.0fc) nototal

Summary for variables: negotiated_amount
Group variable: service_label (Texas 2036 short label for the procedure (our menu))

   service_label |       p50       Min       Max         N
-----------------+----------------------------------------
Cataract surgery |       492       144     3,589    10,694
Colonoscopy diag |       267       108     2,089    25,240
Knee arthroscopy |       528       156     3,348    11,529
MRI lumbar spine |       144        31     1,950    25,938
Office visit est |        85        43       627    38,555
Vaginal delivery |     2,136     1,439    14,737     9,122
----------------------------------------------------------
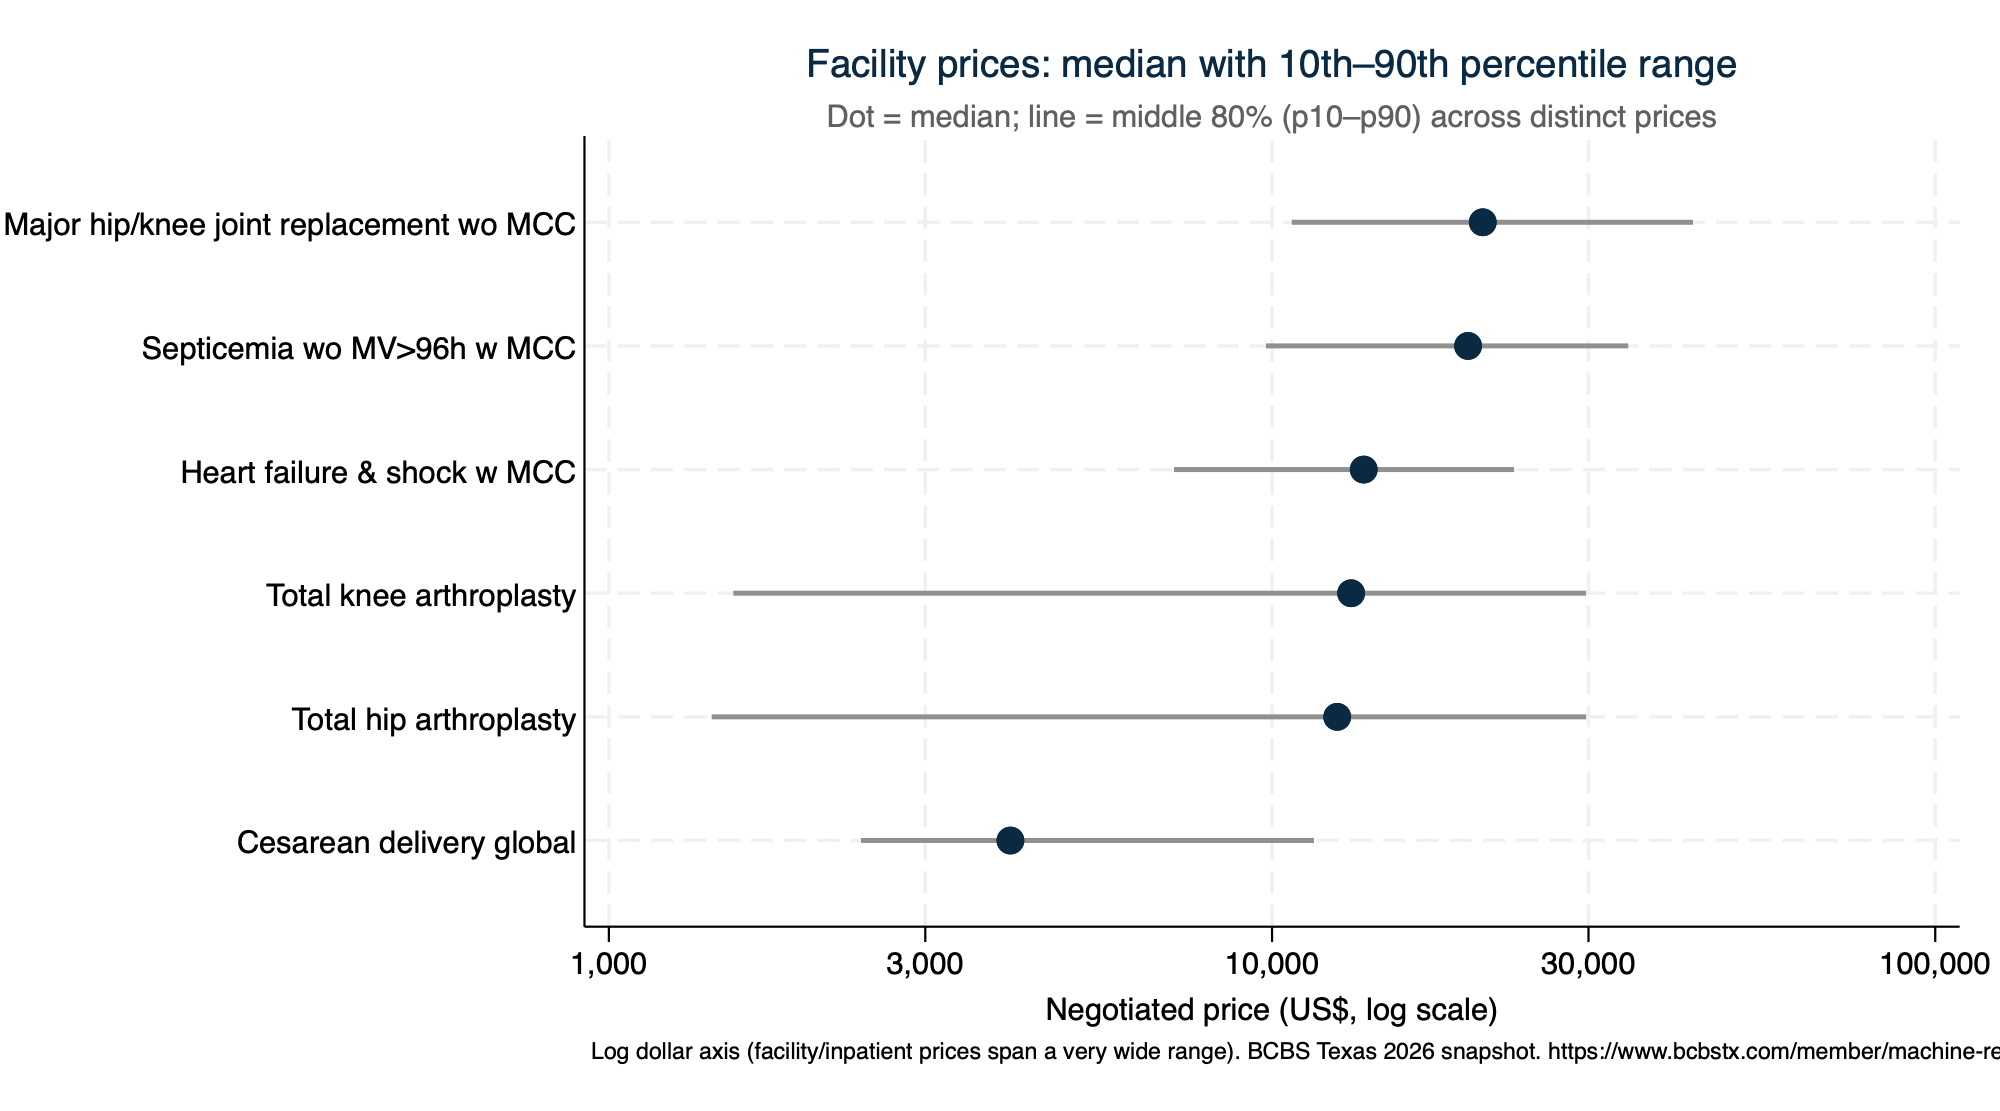
.     tabstat negotiated_amount, by(service_label) statistics(p50 min max n) format(%9.0fc) nototal

Summary for variables: negotiated_amount
Group variable: service_label (Texas 2036 short label for the procedure (our menu))

   service_label |       p50       Min       Max         N
-----------------+----------------------------------------
Cesarean deliver |     4,032       101    83,546     1,681
Heart failure &  |    13,748     4,024    94,514     1,583
Major hip/knee j |    20,784     6,439   156,625     1,534
Septicemia wo MV |    19,751     5,552   142,127     1,532
Total hip arthro |    12,540       814    99,442     3,558
Total knee arthr |    13,160       814    99,442     3,549
----------------------------------------------------------
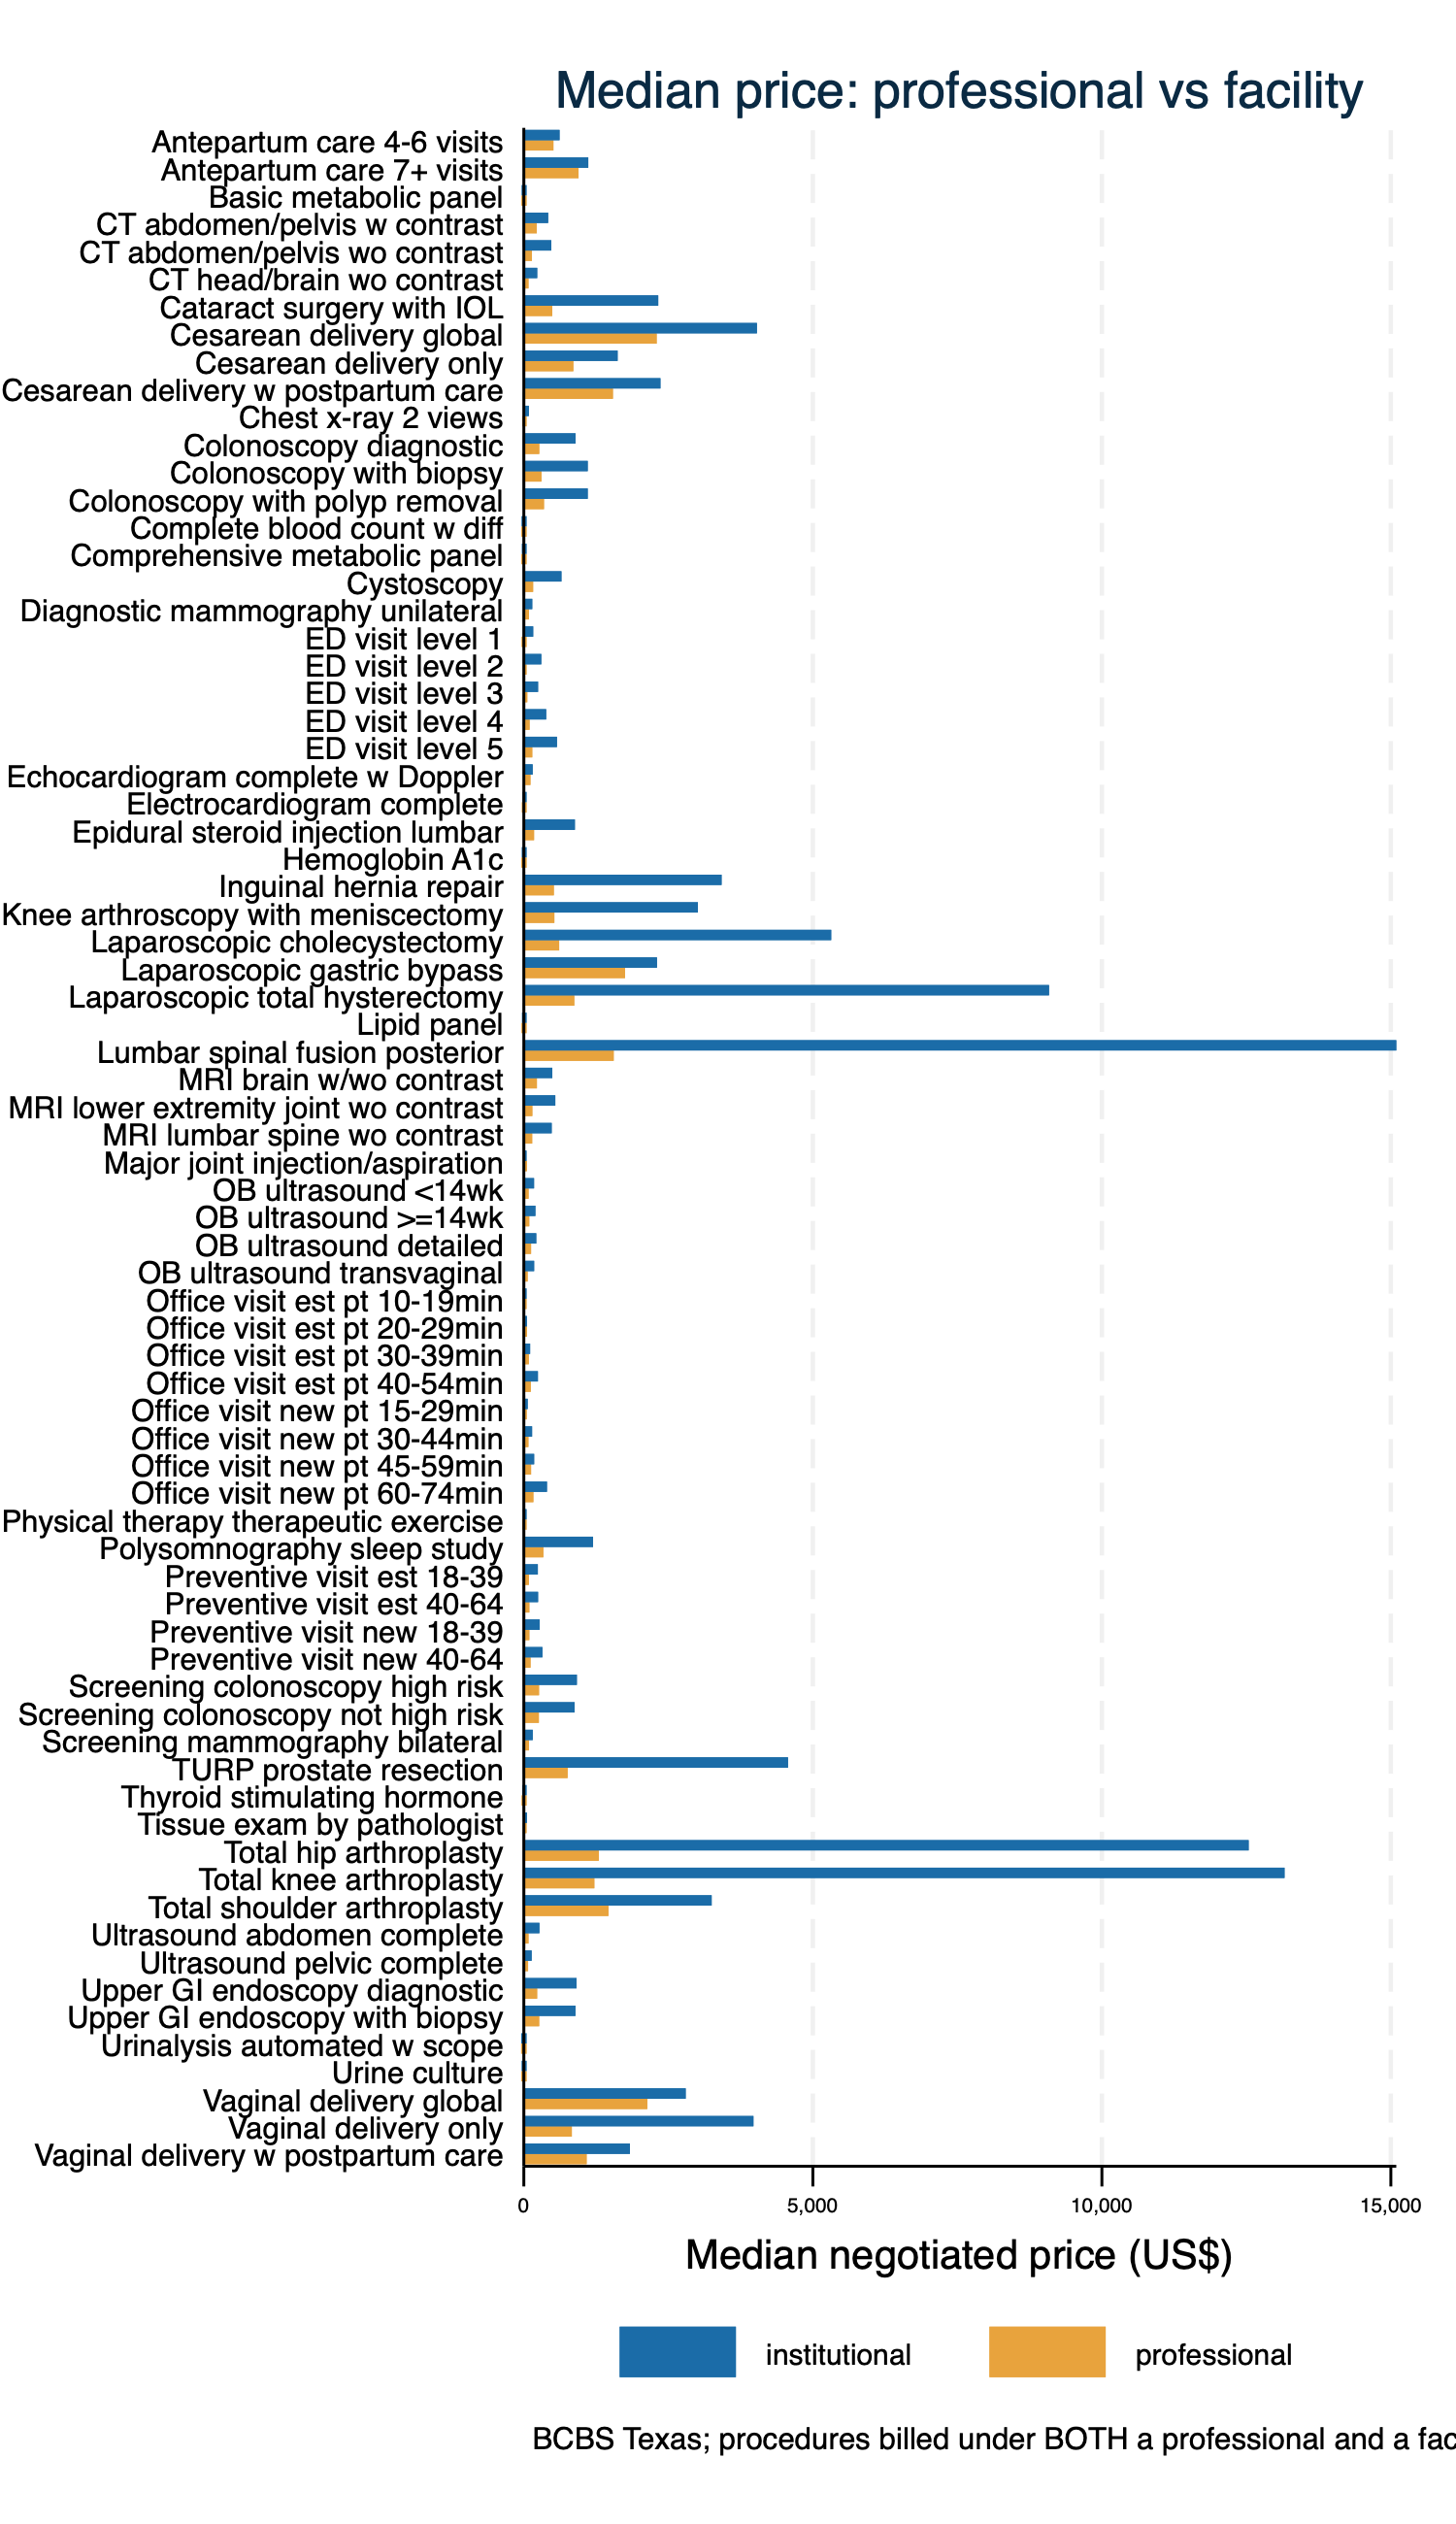
For procedures billed under BOTH a professional and an institutional rate, the median price and the dispersion (CV) of each. Field evidence: facility prices are higher and far more dispersed than professional. (This is the feasible "site of care" lens; a within-payer office-vs-HOPD split is NOT separable — see 400.)
. di as txt "Coefficient of variation, professional vs facility (selected):" Coefficient of variation, professional vs facility (selected): . table service_label provider_type, statistic(mean cv) nformat(%5.2f) --------------------------------------------------------------------------------------------------------------------- | Professional (clinician) / institutional (facility) / both | institutional professional Total ----------------------------------------------------+---------------------------------------------------------------- Texas 2036 short label for the procedure (our menu) | Antepartum care 4-6 visits | 1.44 0.43 0.94 Antepartum care 7+ visits | 1.13 0.42 0.78 Basic metabolic panel | 1.01 0.32 0.66 CT abdomen/pelvis w contrast | 1.05 0.78 0.92 CT abdomen/pelvis wo contrast | 0.99 0.82 0.90 CT head/brain wo contrast | 0.99 1.18 1.08 Cataract surgery with IOL | 0.66 0.66 0.66 Cesarean delivery global | 1.39 0.48 0.93 Cesarean delivery only | 1.34 0.56 0.95 Cesarean delivery w postpartum care | 1.39 0.44 0.92 Chest x-ray 2 views | 0.78 0.75 0.77 Colonoscopy diagnostic | 0.68 0.53 0.60 Colonoscopy with biopsy | 0.66 0.59 0.63 Colonoscopy with polyp removal | 0.67 0.55 0.61 Complete blood count w diff | 0.97 0.28 0.63 Comprehensive metabolic panel | 0.96 0.85 0.91 Cystoscopy | 1.04 0.66 0.85 Diagnostic mammography unilateral | 0.65 0.79 0.72 ED visit level 1 | 1.03 0.87 0.95 ED visit level 2 | 1.48 0.51 0.99 ED visit level 3 | 1.60 0.49 1.05 ED visit level 4 | 1.92 0.52 1.22 ED visit level 5 | 1.21 0.50 0.86 Echocardiogram complete w Doppler | 0.87 0.72 0.79 Electrocardiogram complete | 0.77 0.50 0.63 Epidural steroid injection lumbar | 0.69 0.58 0.64 Hemoglobin A1c | 0.86 0.40 0.63 Inguinal hernia repair | 0.68 0.50 0.59 Knee arthroscopy with meniscectomy | 0.68 0.51 0.60 Laparoscopic cholecystectomy | 0.68 0.51 0.60 Laparoscopic gastric bypass | 1.42 0.47 0.95 Laparoscopic total hysterectomy | 0.72 0.54 0.63 Lipid panel | 0.87 0.48 0.67 Lumbar spinal fusion posterior | 0.68 0.56 0.62 MRI brain w/wo contrast | 0.86 0.84 0.85 MRI lower extremity joint wo contrast | 0.83 0.95 0.89 MRI lumbar spine wo contrast | 0.80 0.89 0.85 Major joint injection/aspiration | 3.34 0.50 1.92 OB ultrasound <14wk | 0.62 0.71 0.67 OB ultrasound >=14wk | 0.59 0.75 0.67 OB ultrasound detailed | 0.62 0.65 0.63 OB ultrasound transvaginal | 0.74 0.73 0.74 Office visit est pt 10-19min | 0.88 0.52 0.70 Office visit est pt 20-29min | 0.80 0.48 0.64 Office visit est pt 30-39min | 0.78 0.46 0.62 Office visit est pt 40-54min | 0.62 0.46 0.54 Office visit new pt 15-29min | 0.80 0.54 0.67 Office visit new pt 30-44min | 0.64 0.48 0.56 Office visit new pt 45-59min | 0.78 0.48 0.63 Office visit new pt 60-74min | 0.60 0.45 0.53 Physical therapy therapeutic exercise | 0.83 0.62 0.73 Polysomnography sleep study | 0.62 0.87 0.74 Preventive visit est 18-39 | 0.53 0.48 0.51 Preventive visit est 40-64 | 0.58 0.48 0.53 Preventive visit new 18-39 | 0.51 0.49 0.50 Preventive visit new 40-64 | 0.55 0.48 0.51 Screening colonoscopy high risk | 0.69 0.55 0.62 Screening colonoscopy not high risk | 0.68 0.43 0.56 Screening mammography bilateral | 0.66 0.79 0.72 TURP prostate resection | 0.69 0.48 0.59 Thyroid stimulating hormone | 0.83 0.51 0.67 Tissue exam by pathologist | 0.83 1.00 0.91 Total hip arthroplasty | 0.85 0.49 0.67 Total knee arthroplasty | 0.80 0.62 0.71 Total shoulder arthroplasty | 1.35 0.47 0.91 Ultrasound abdomen complete | 0.65 0.77 0.71 Ultrasound pelvic complete | 0.81 0.80 0.81 Upper GI endoscopy diagnostic | 0.68 0.58 0.63 Upper GI endoscopy with biopsy | 0.70 0.63 0.66 Urinalysis automated w scope | 1.32 0.43 0.87 Urine culture | 0.95 0.37 0.66 Vaginal delivery global | 1.47 0.47 0.97 Vaginal delivery only | 0.55 0.46 0.51 Vaginal delivery w postpartum care | 1.38 0.46 0.92 Total | 0.92 0.59 0.75 ---------------------------------------------------------------------------------------------------------------------
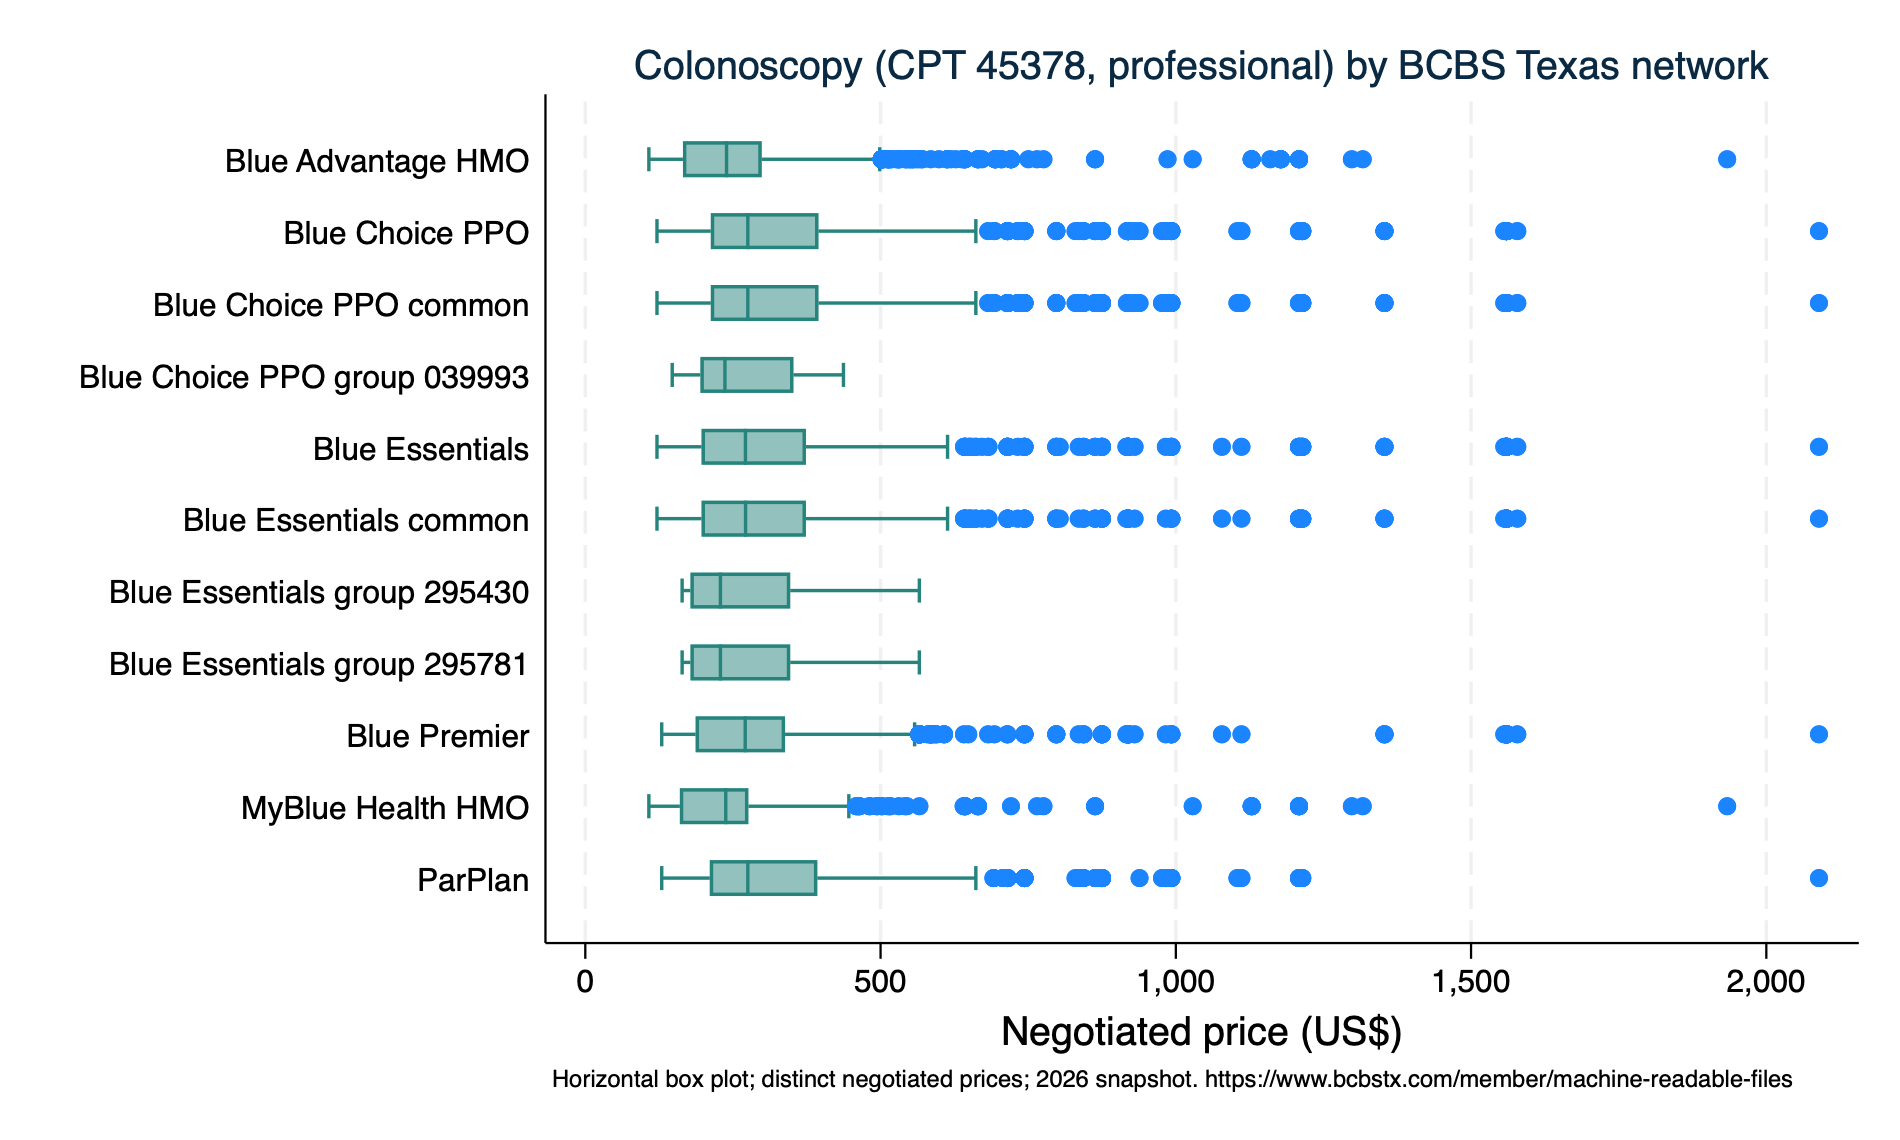
Whether the same service is priced differently across BCBSTX's Texas networks and between coverage segments. Texas 2036 wants payer/plan-level comparison; payer MRFs supply it natively (hospital MRFs do not).
.     di as txt "Colonoscopy (45378), professional — median by network:"
Colonoscopy (45378), professional — median by network:

.     tabstat negotiated_amount, by(network_name) statistics(p50 min max n) format(%9.0fc) nototal

Summary for variables: negotiated_amount
Group variable: network_name (Provider network the price applies to (e.g., Blue Choice PPO))

    network_name |       p50       Min       Max         N
-----------------+----------------------------------------
Blue Advantage H |       239       108     1,934     3,527
 Blue Choice PPO |       275       121     2,089     3,722
Blue Choice PPO  |       275       121     2,089     3,719
Blue Choice PPO  |       236       147       437        29
 Blue Essentials |       271       121     2,089     3,667
Blue Essentials  |       271       121     2,089     3,662
Blue Essentials  |       229       164       566        20
Blue Essentials  |       229       164       566        20
    Blue Premier |       271       129     2,089     2,031
MyBlue Health HM |       238       108     1,934     1,691
         ParPlan |       275       129     2,089     3,152
----------------------------------------------------------

.     di as txt _n "By coverage segment:"

By coverage segment:

.     tabstat negotiated_amount, by(market_segment) statistics(p50 n) format(%9.0fc) nototal

Summary for variables: negotiated_amount
Group variable: market_segment (Coverage segment served (fully-insured / self-funded / both))

market_segment |       p50         N
---------------+--------------------
          both |       267    14,068
 fully-insured |       256     7,424
   self-funded |       275     3,748
------------------------------------
Each negotiated price divided by the national Medicare allowed amount for the same service (Medicare = 100%). This standardizes for how resource-intensive a service is and gives one interpretable yardstick. Benchmark by how the service is billed: professional -> Medicare Physician Fee Schedule; outpatient facility -> Hospital Outpatient PPS; inpatient -> Inpatient PPS (MS-DRG weight x base). National figures, all geographic indices = 1.0 (first-pass simplification). NOTE this is the negotiated PRICE relative to Medicare, NOT spending.
. di as txt "Prices with a Medicare benchmark match: `nmatch' of `ntot'"
Prices with a Medicare benchmark match: 1437200 of 1728270

. di as txt _n "Median % of Medicare (100 = Medicare), with p25/p75, by service category and provider type:"

Median % of Medicare (100 = Medicare), with p25/p75, by service category and provider type:

. frame _pom: list service_category provider_type median p25 p75 n, noobs sep(0) abbreviate(24)

  +--------------------------------------------------------------------+
  |     service_category   provider_type   median   p25   p75        n |
  |--------------------------------------------------------------------|
  |           Cardiology   institutional       27    24    64     3735 |
  |           Cardiology    professional       80    46   115    39238 |
  |       E&M outpatient    professional       64    51    78   303518 |
  |            Emergency   institutional      127    85   375    17216 |
  |            Emergency    professional       87    78    99    80788 |
  |              Imaging   institutional      155    96   365    28406 |
  |              Imaging    professional       72    28    86   259052 |
  |        Inpatient DRG   institutional      146   102   199    20259 |
  |    Inpatient surgery   institutional       85    53   135    29191 |
  |    Inpatient surgery    professional      109    88   141    97077 |
  |                  Lab   institutional      102    84   279     3833 |
  |                  Lab    professional       47    27    56    11906 |
  |            Maternity   institutional      130    85   242    11369 |
  |            Maternity    professional       83    61   107   182247 |
  |        Maternity DRG   institutional      130    92   186     5570 |
  | Outpatient procedure   institutional       90    63   148    39295 |
  | Outpatient procedure    professional       72    46   101   257501 |
  |           Preventive   institutional       94    69   149     7009 |
  |           Preventive    professional       69    48    87    39990 |
  +--------------------------------------------------------------------+
Same idea applied to the Medicare benchmark: bars show the median price as a percent of Medicare (100 = Medicare) by service category, with a reference line at 100, re-drawn live as you filter by provider type and Public Health Region. Why run it: the headline pattern (professional below, facility above Medicare) hides category- and region-level exceptions — this surfaces them, e.g. 'which services run above Medicare for facilities in Region 6/5S?' The bars use the median (robust to the ghost-rate skew; see 5b). (Representative ~40k-row sample.)
Where a Medicare benchmark exists, we flag prices below 25% of Medicare as likely ghost/placeholder rates and show how the median moves when they are excluded. This makes the ghost-rate distortion visible; it is a rough heuristic, not the taxonomy-based gold standard (see the guide).
. count if likely_ghost
  63,017

. di as txt "Prices flagged implausibly low (<25% of Medicare): `r(N)'"
Prices flagged implausibly low (<25% of Medicare): 63017

. preserve

.     keep if provider_type=="professional" & !missing(pct_of_medicare)
(456,953 observations deleted)

.     di as txt "Professional % of Medicare — median including ALL prices:"
Professional % of Medicare — median including ALL prices:

.     summarize pct_of_medicare, detail

     Negotiated price as % of Medicare (100 = Medicare)
-------------------------------------------------------------
      Percentiles      Smallest
 1%     20.75083       7.492949
 5%      25.6207       7.492949
10%     30.09686       9.162832       Obs           1,271,317
25%     48.24082       9.162832       Sum of wgt.   1,271,317

50%     75.30528                      Mean           81.04896
                        Largest       Std. dev.      55.67103
75%     95.03719       1220.084
90%     131.2908       1267.011       Variance       3099.263
95%     159.2426       1267.011       Skewness       4.167001
99%     321.1187       1267.011       Kurtosis       35.72982

.     local m_all = r(p50)

.     di as txt "Professional % of Medicare — median EXCLUDING likely-ghost prices:"
Professional % of Medicare — median EXCLUDING likely-ghost prices:

.     summarize pct_of_medicare if !likely_ghost, detail

     Negotiated price as % of Medicare (100 = Medicare)
-------------------------------------------------------------
      Percentiles      Smallest
 1%     25.90058       25.00083
 5%     29.21877       25.00083
10%     34.30012       25.00396       Obs           1,215,914
25%     52.82027       25.00396       Sum of wgt.   1,215,914

50%     76.87997                      Mean           83.75688
                        Largest       Std. dev.      55.42285
75%     96.96527       1220.084
90%     133.3009       1267.011       Variance       3071.693
95%     160.8513       1267.011       Skewness       4.325711
99%     326.5134       1267.011       Kurtosis       37.11026

.     di as txt _n "  median % of Medicare:  all = " %4.0f `m_all' "%   vs   ex-ghost = " %4.0f r(p50) "%"

  median % of Medicare:  all =   75%   vs   ex-ghost =   77%

.     di as txt "  (the gap is the rough size of the ghost-rate drag on the professional figure)"
  (the gap is the rough size of the ghost-rate drag on the professional figure)

. restore
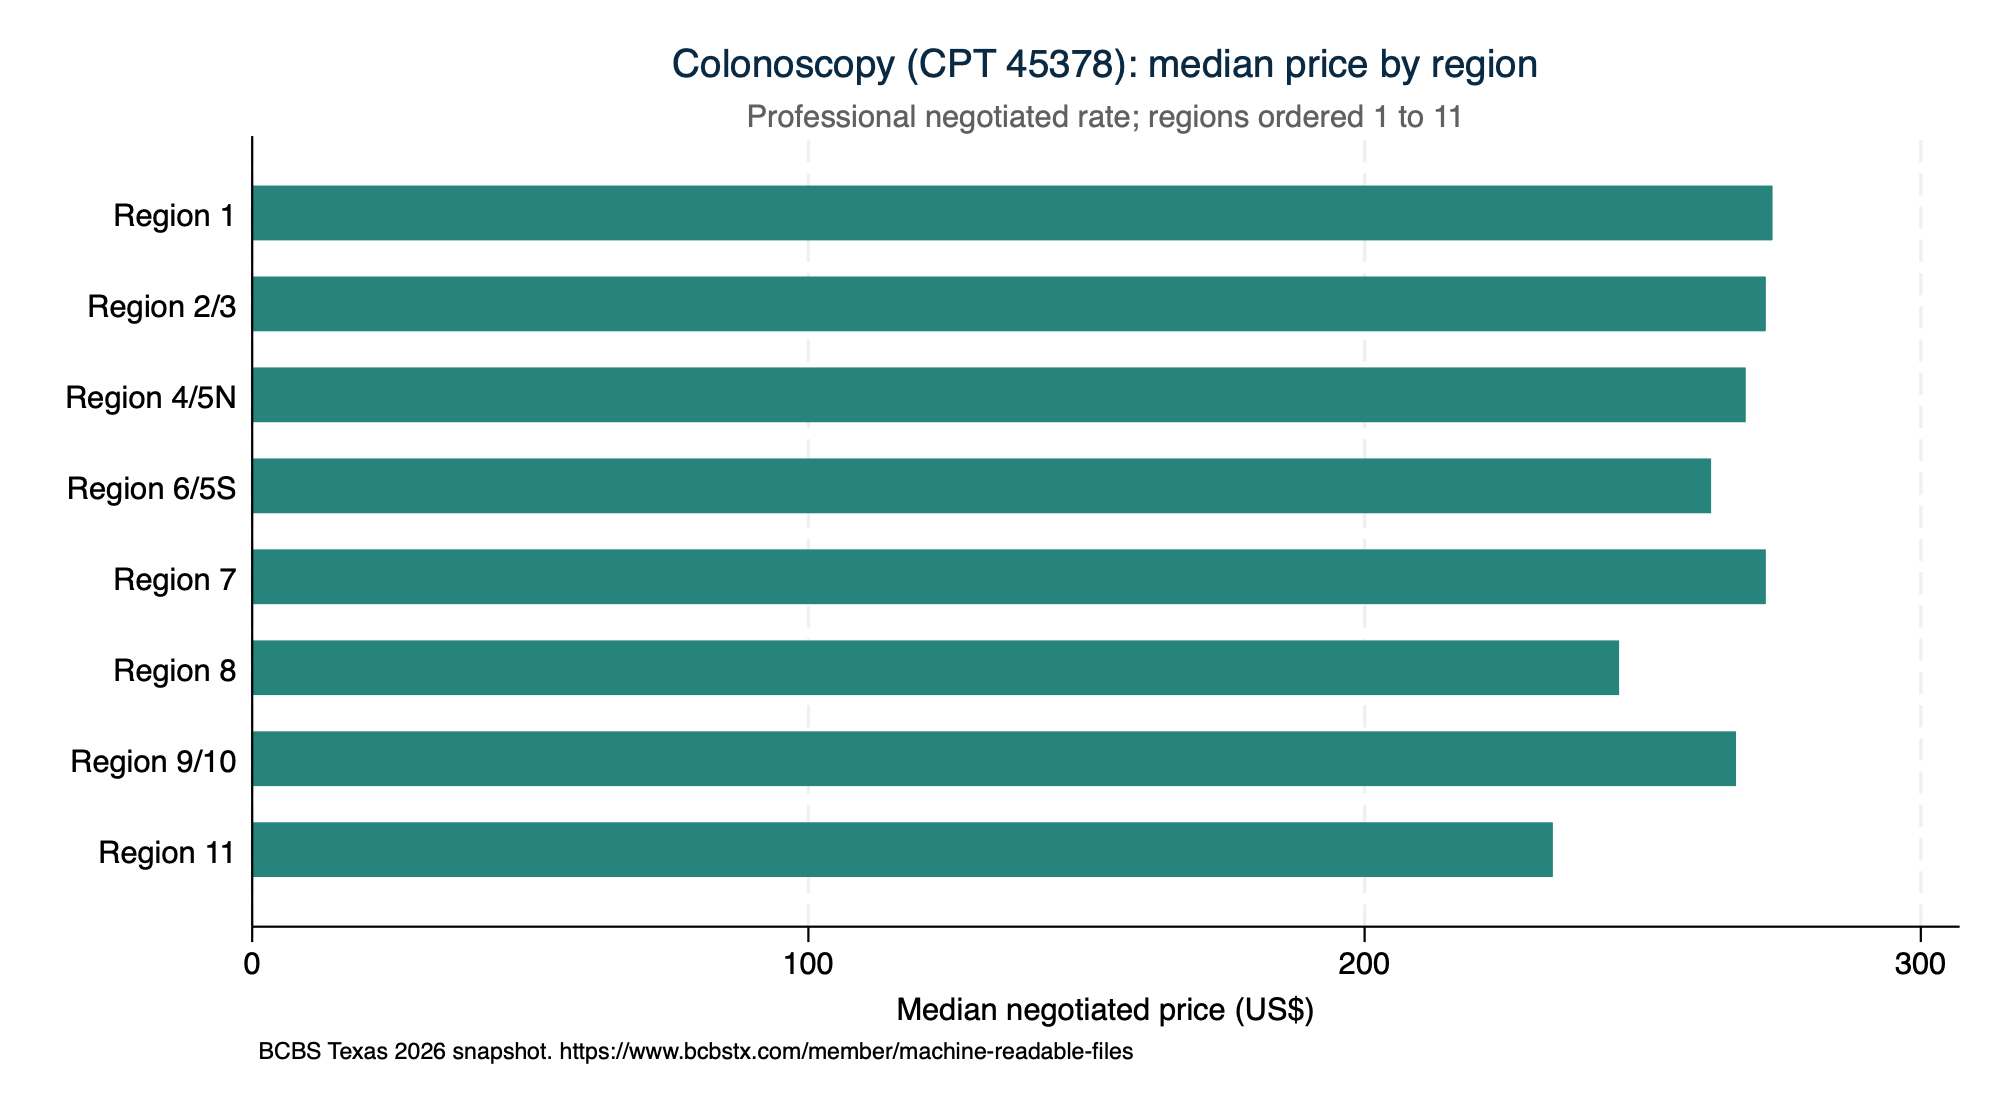
Each price is tagged with the county (and its DSHS Public Health Region) of the provider group's practice location (NPPES practice ZIP -> county -> region). Prices with no county/region (provider registered out of state, unmapped ZIP, or a TIN-only group with no resolvable NPI) are excluded from this section.
. preserve

.     keep if procedure_code=="45378" & provider_type=="professional"
(1,689,483 observations deleted)

.     tabstat negotiated_amount, by(region_id) statistics(p50 p10 p90 n) format(%9.0f) nototal

Summary for variables: negotiated_amount
Group variable: region_id

  region_id |       p50       p10       p90         N
------------+----------------------------------------
   Region 1 |       273       149       502      2052
 Region 2/3 |       272       152       493      5695
Region 4/5N |       268       149       501      2929
Region 6/5S |       262       149       450      3440
   Region 7 |       272       149       493      4062
   Region 8 |       246       149       399      3036
Region 9/10 |       267       149       493      2035
  Region 11 |       234       149       388      1723
-----------------------------------------------------

. restore
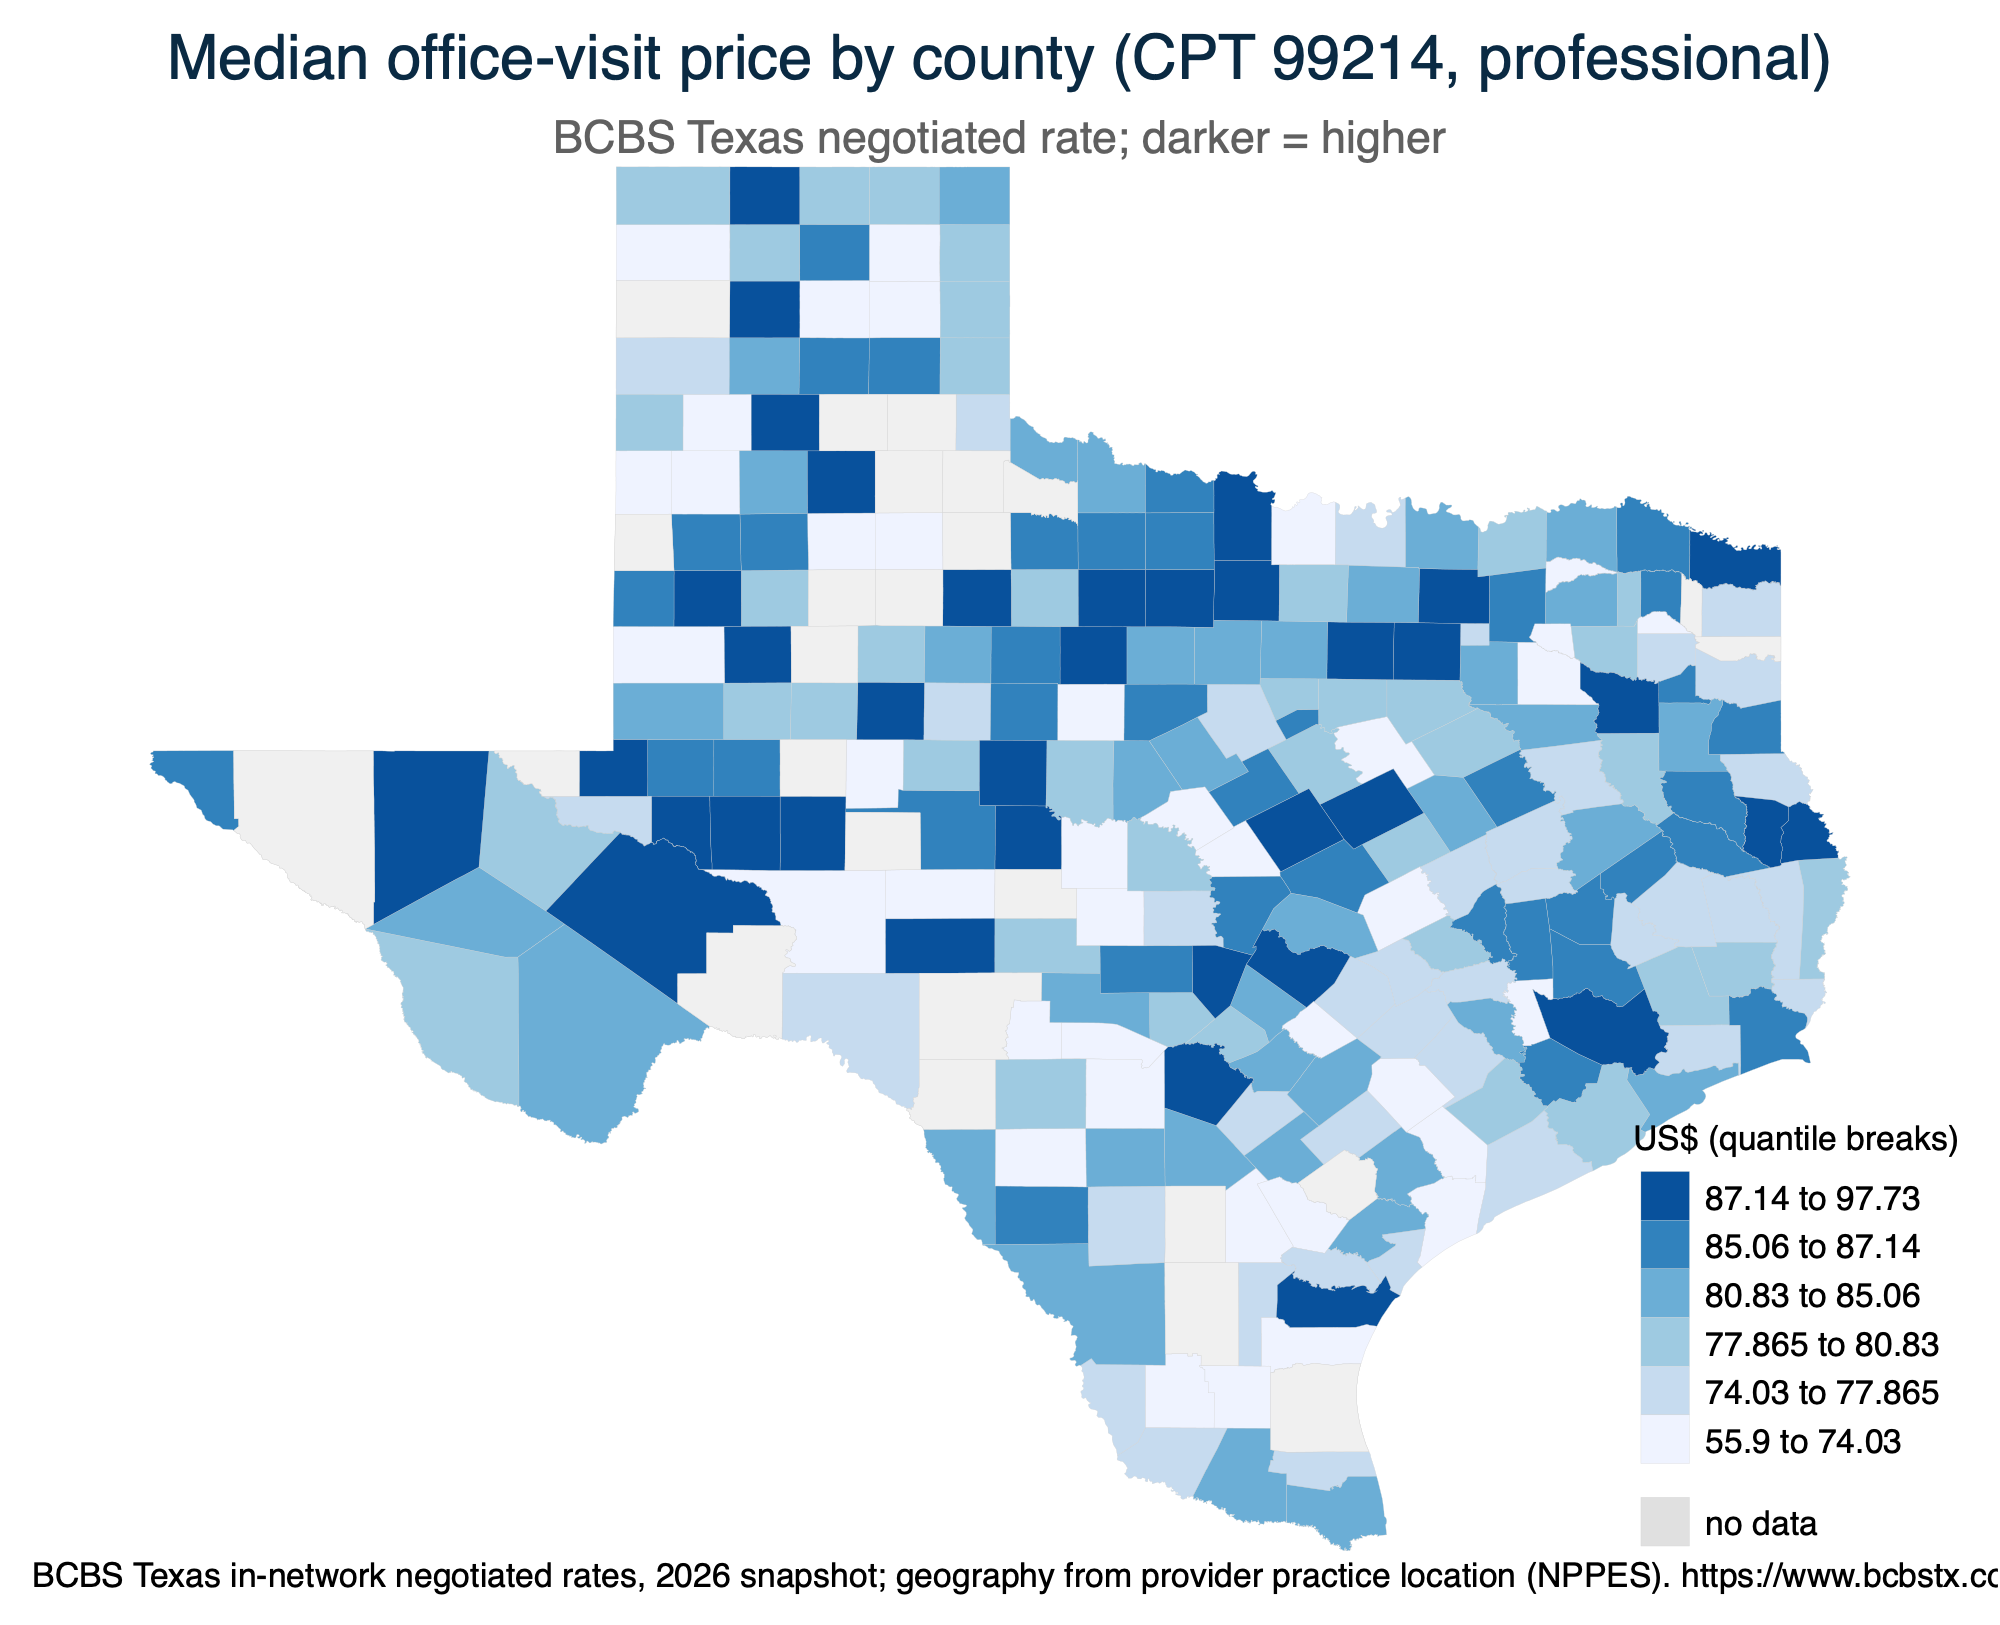
Median negotiated price for an established-patient office visit (CPT 99214, professional) by county. Counties with fewer than 5 distinct prices are left unshaded. Built with spmap on the Census county shapefile (see 03_mapping/).
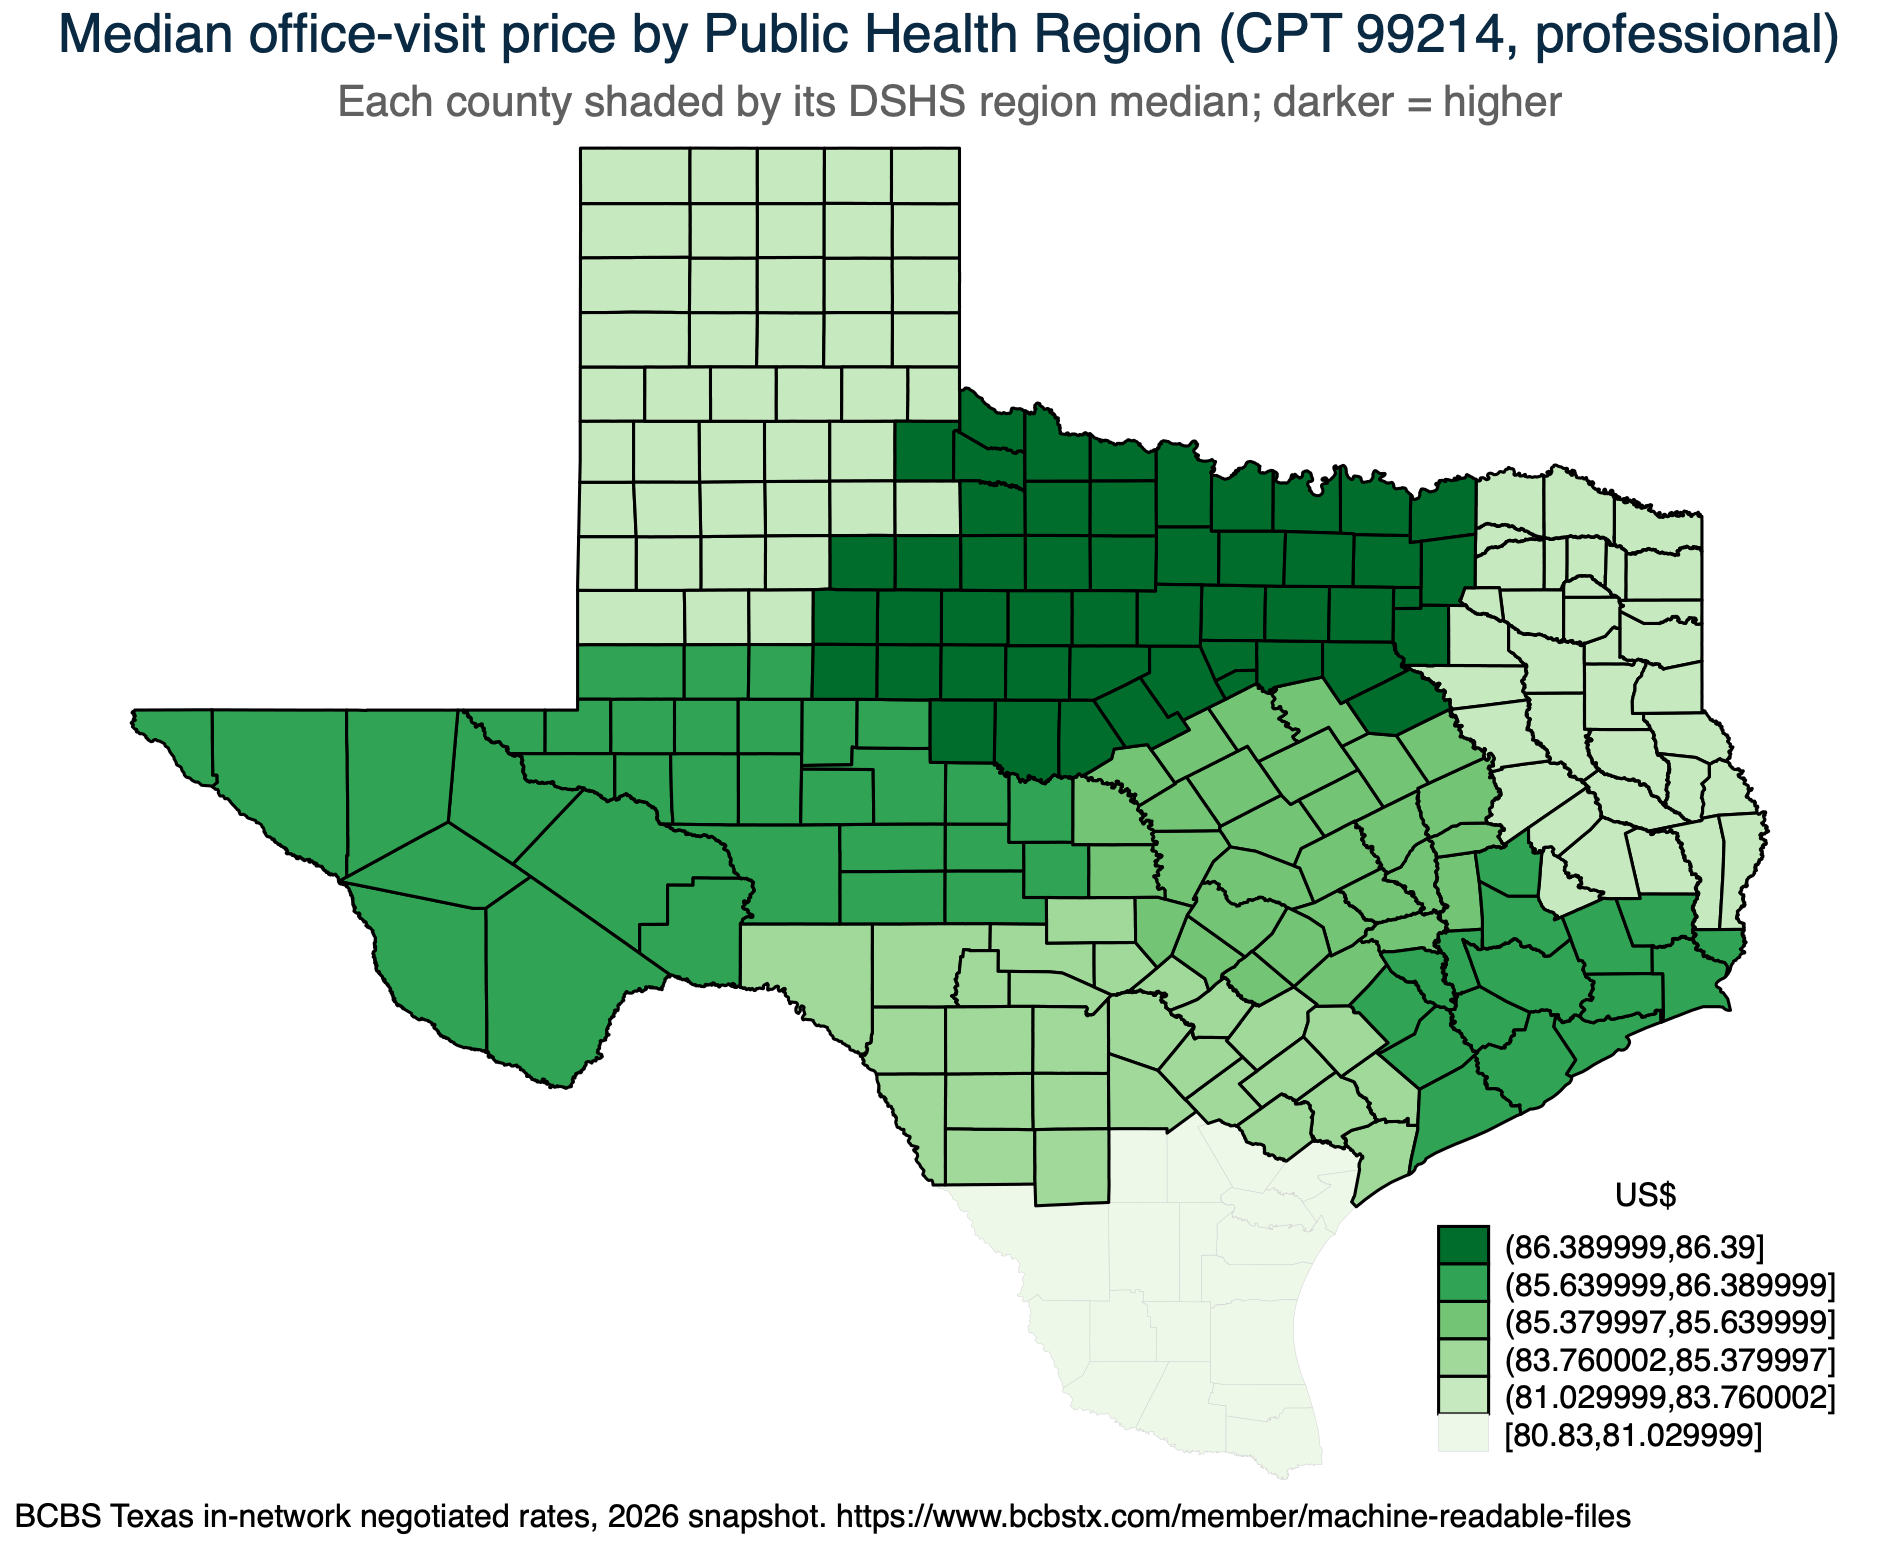
The same metric collapsed to the 8 DSHS Public Health Regions (each county shaded by its region's median), the Texas 2036 signature geographic cut.
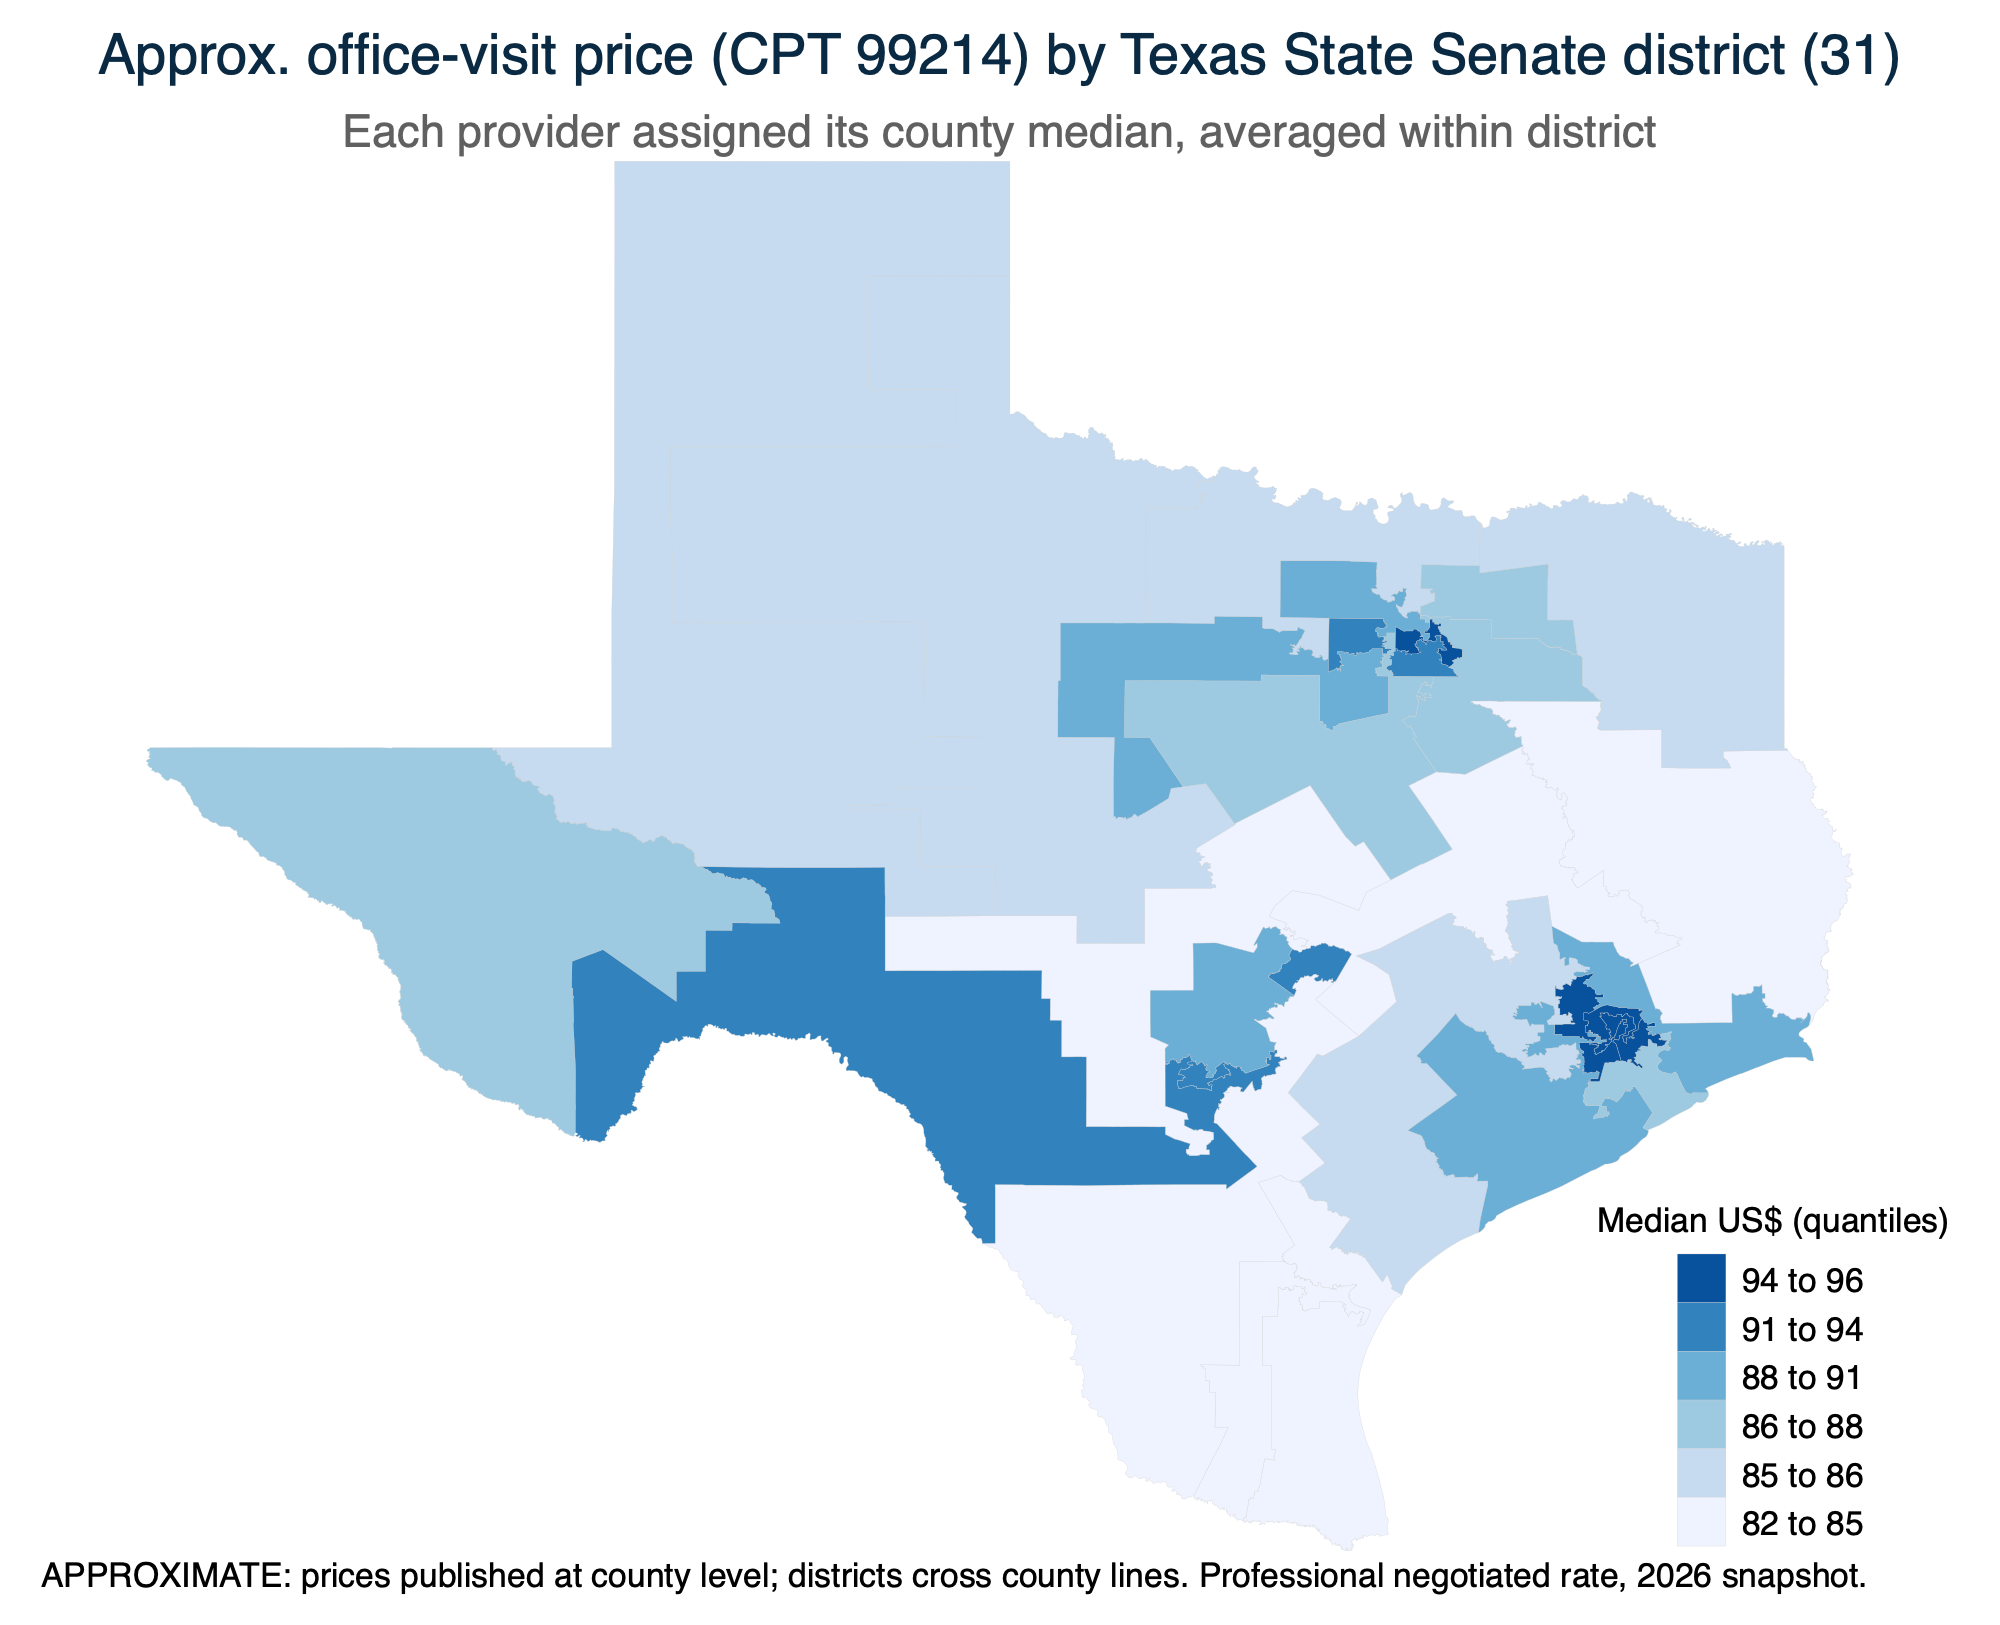
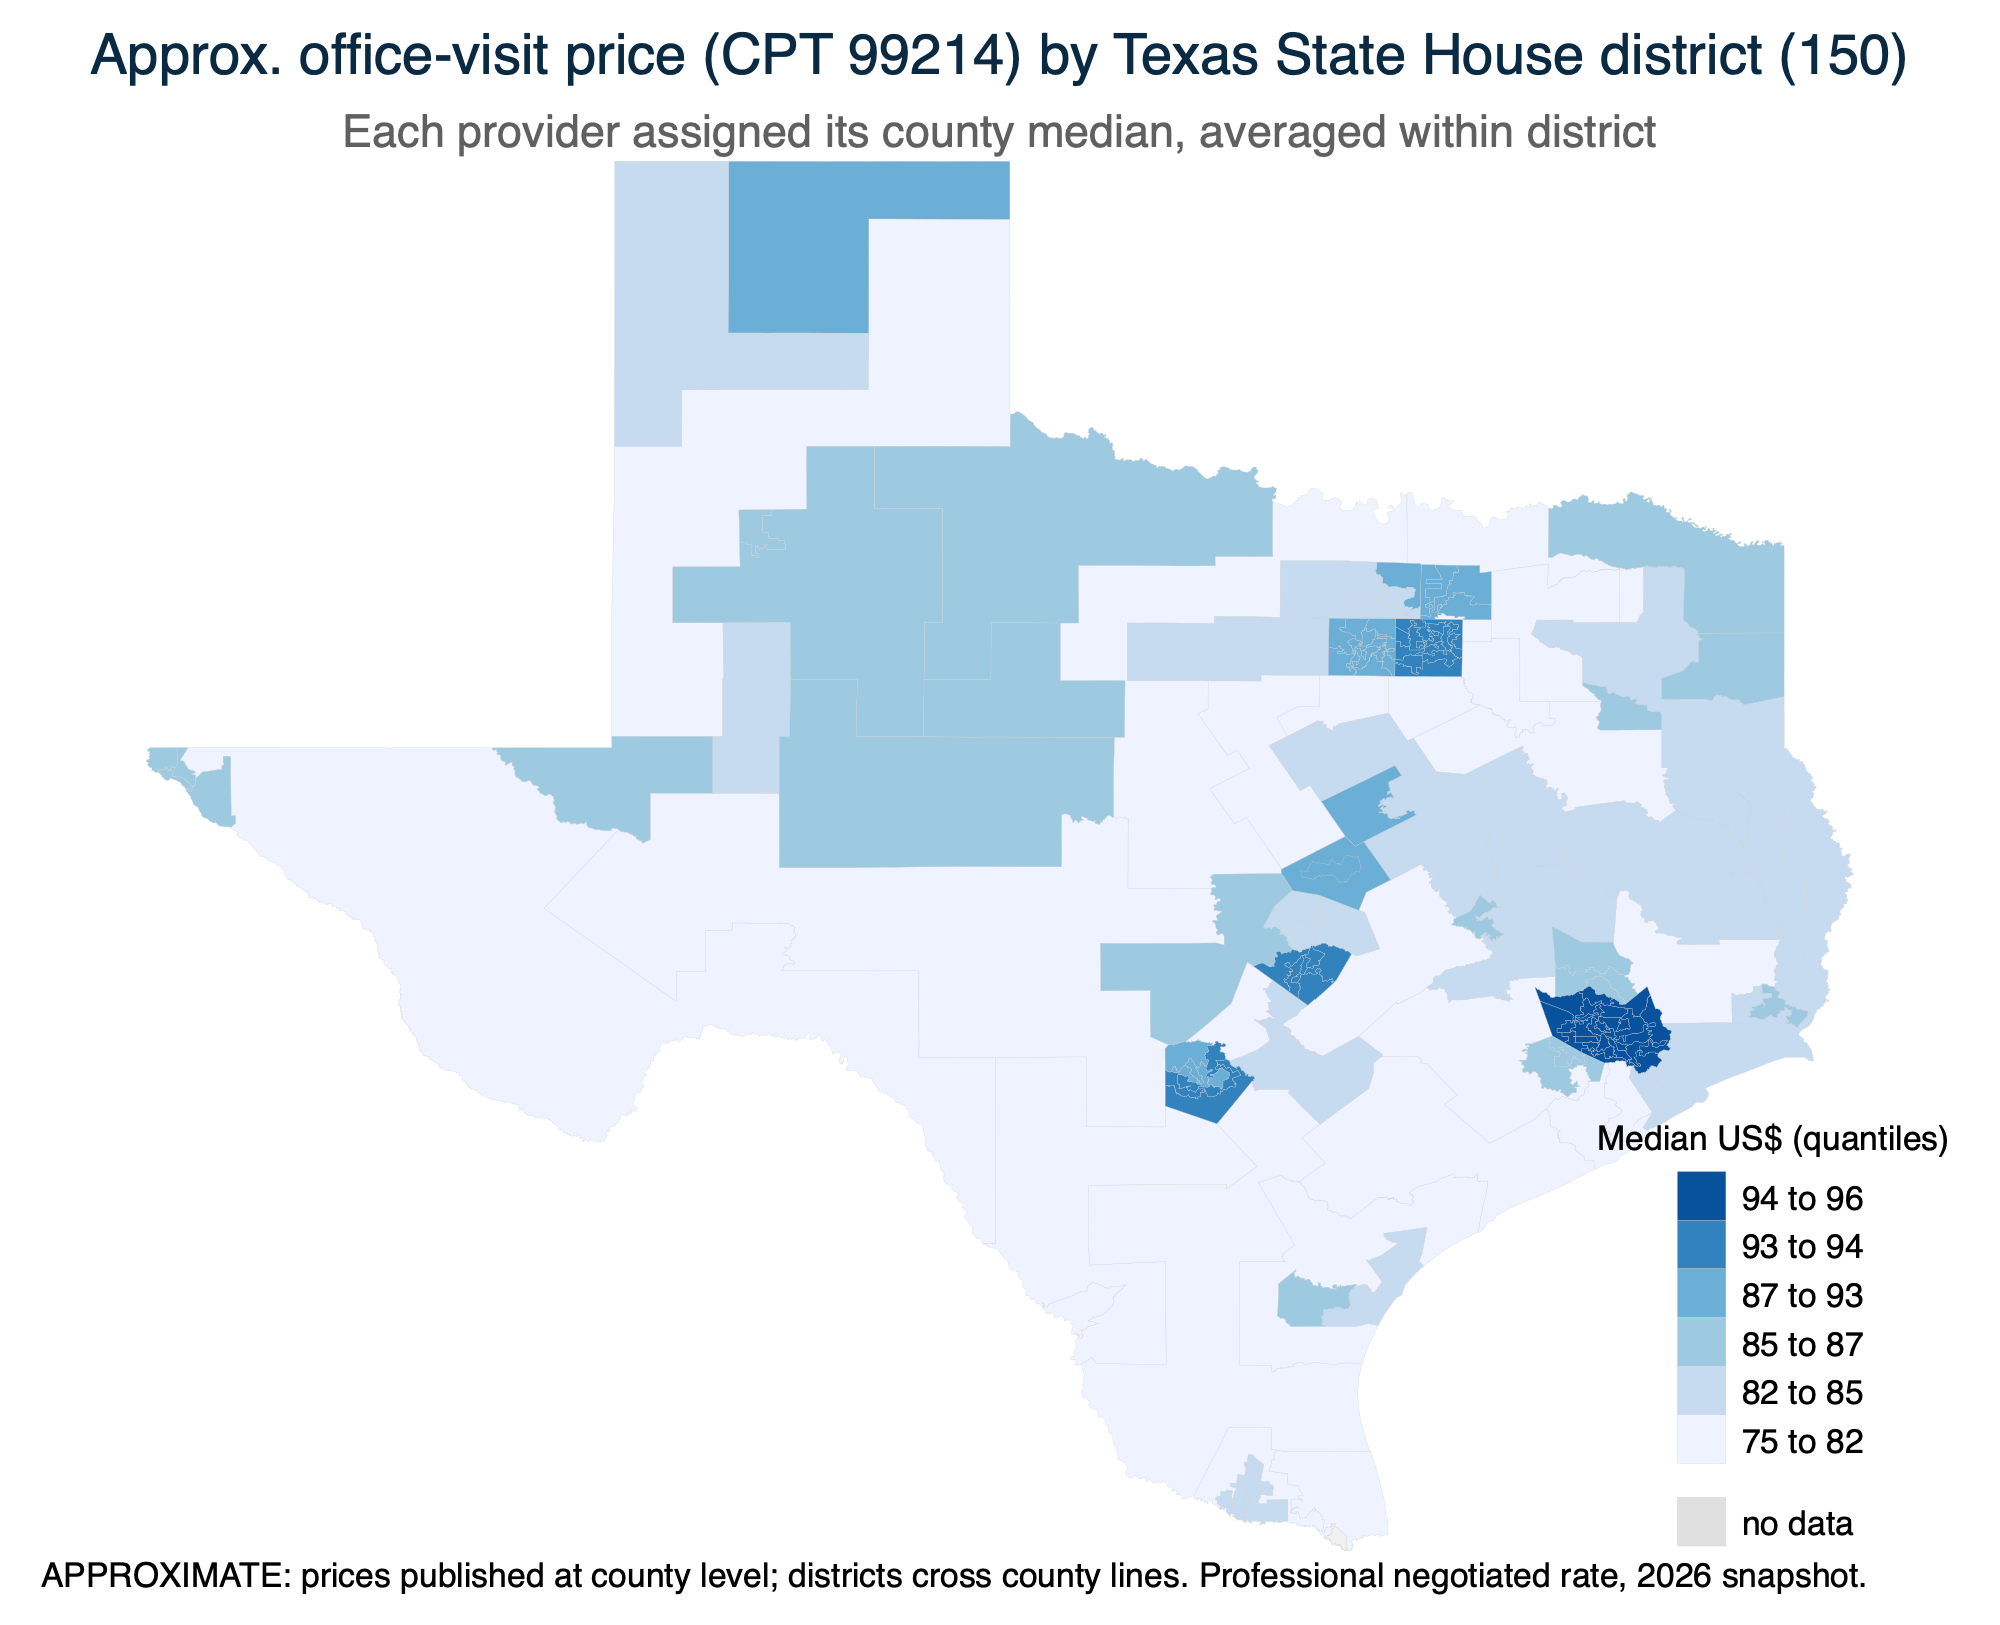
Median office-visit price (CPT 99214, professional) by Texas State Senate and House district. IMPORTANT — this is APPROXIMATE: published prices are keyed to COUNTY, and districts cross county lines, so we assign each provider its county median, then average within district (weighted by how many of the district's providers sit in each county). An exact version needs a district-keyed re-extraction of the raw files. Read it for broad geographic patterns, not precise district figures.
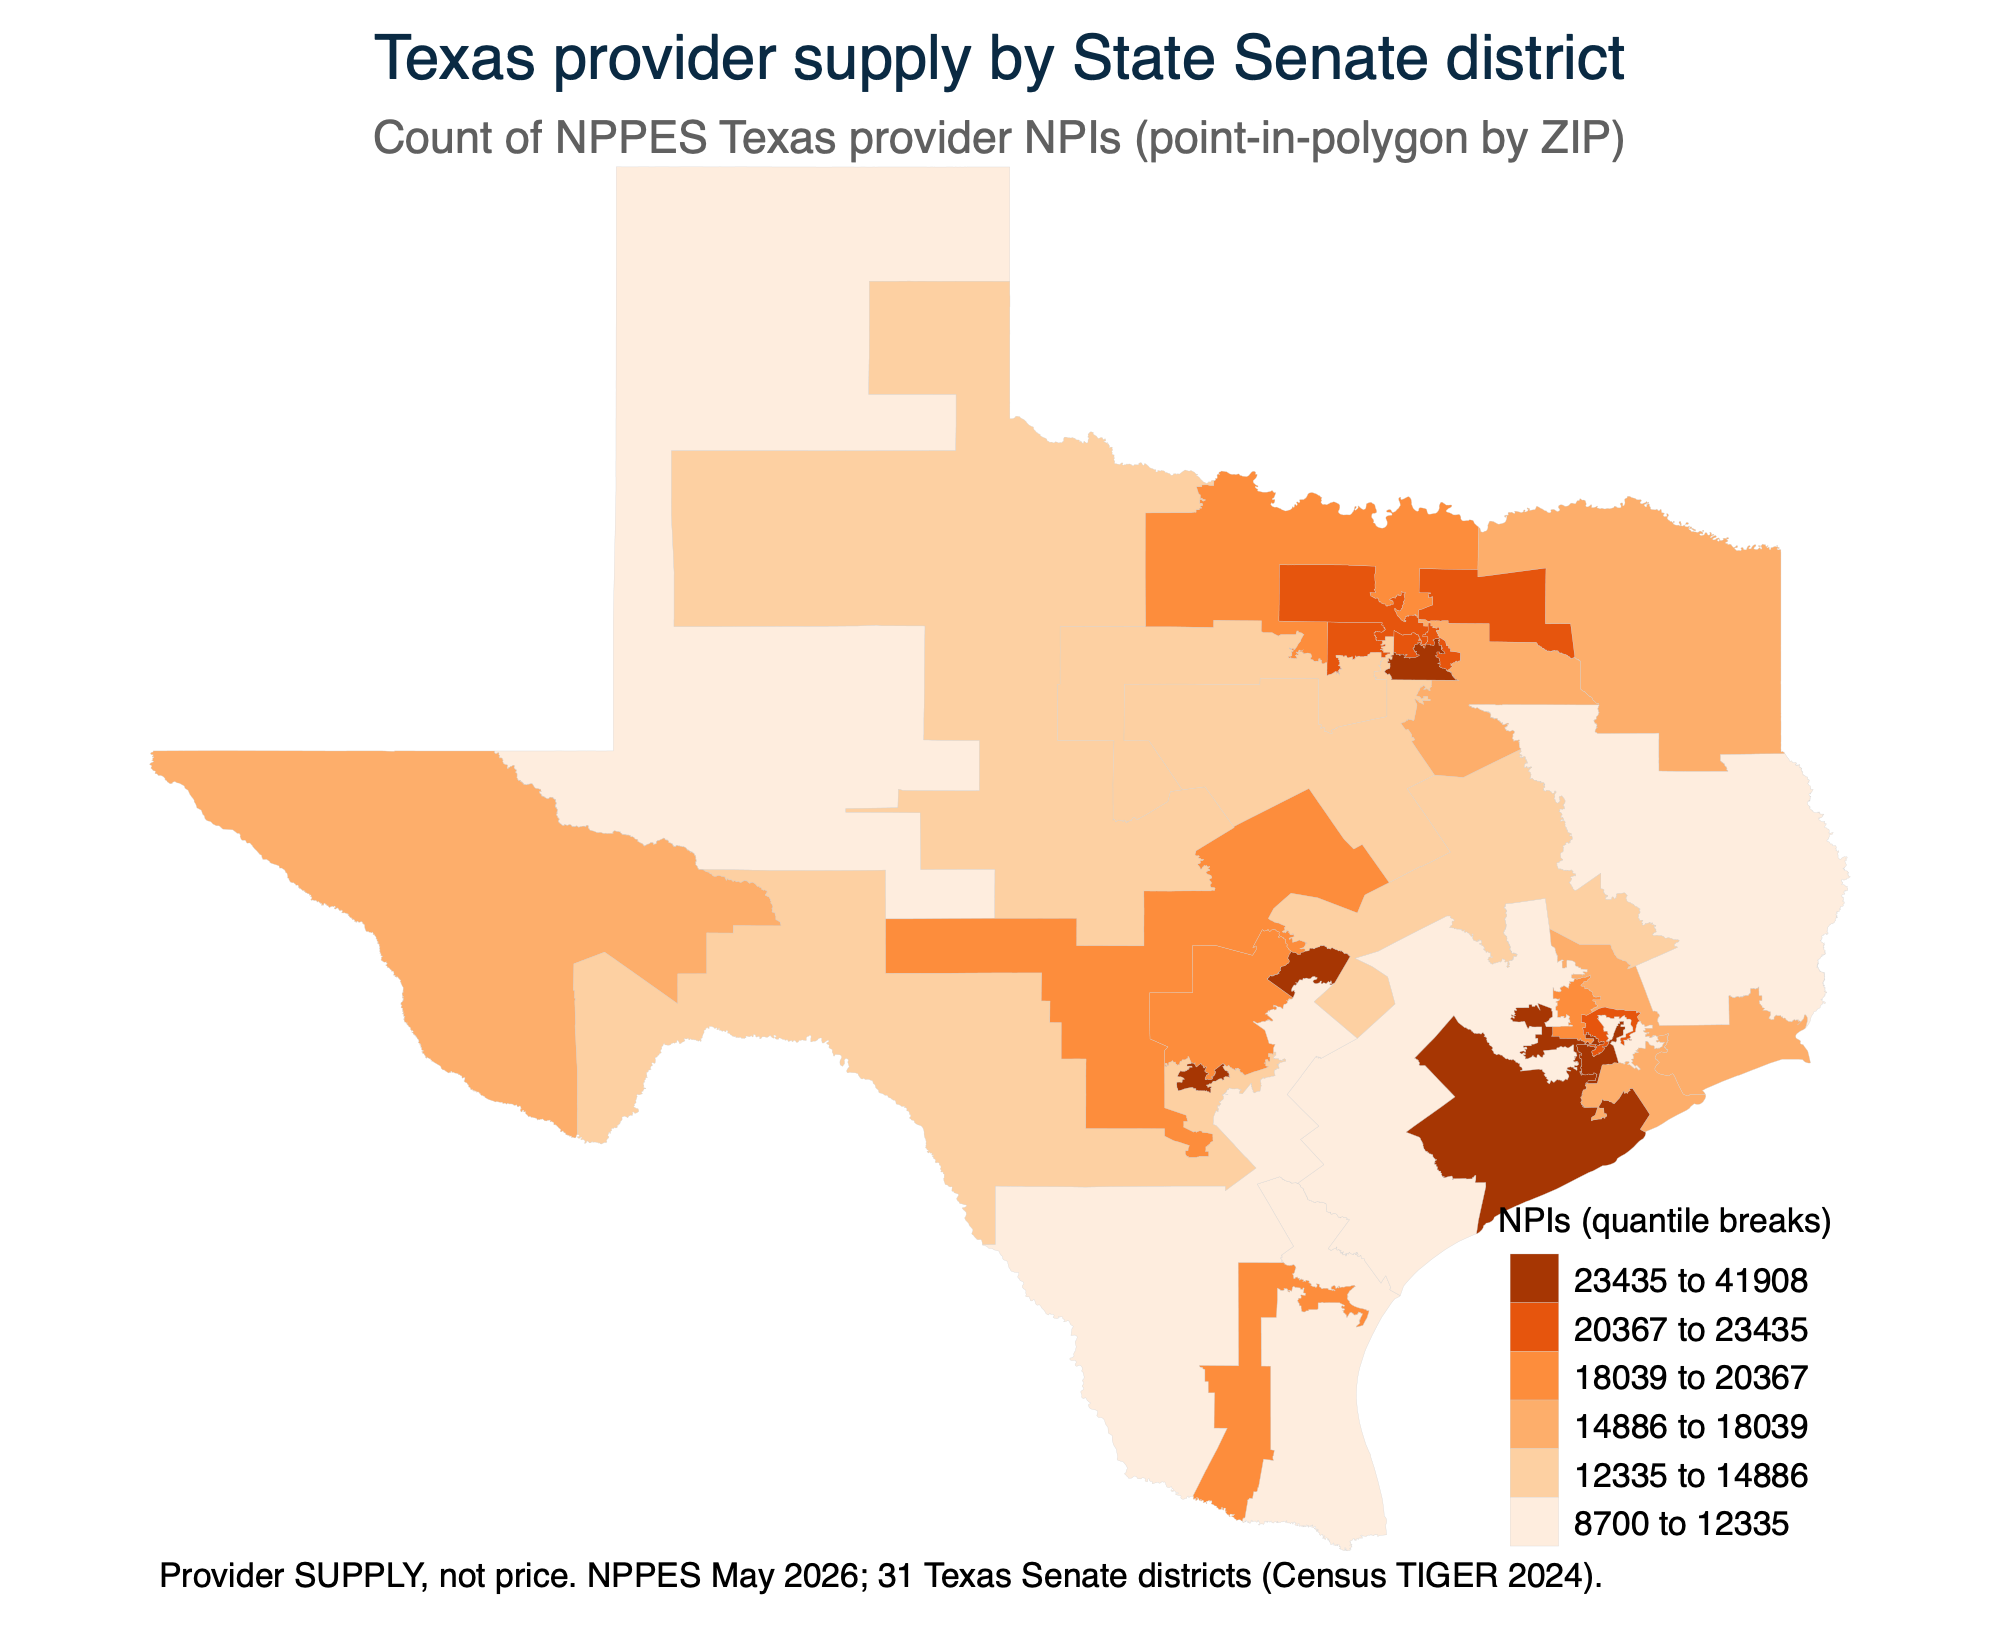
Count of Texas provider NPIs (from the NPPES registry) whose practice location falls inside each of the 31 Texas State Senate districts, assigned by point-in-polygon geocoding of the provider ZIP. This shows where providers are concentrated. IMPORTANT: this is provider SUPPLY (a count), not price. The approximate district PRICE map is above; an EXACT price-by-district map would need a district-keyed re-extraction, since the price table is keyed on county, not district.
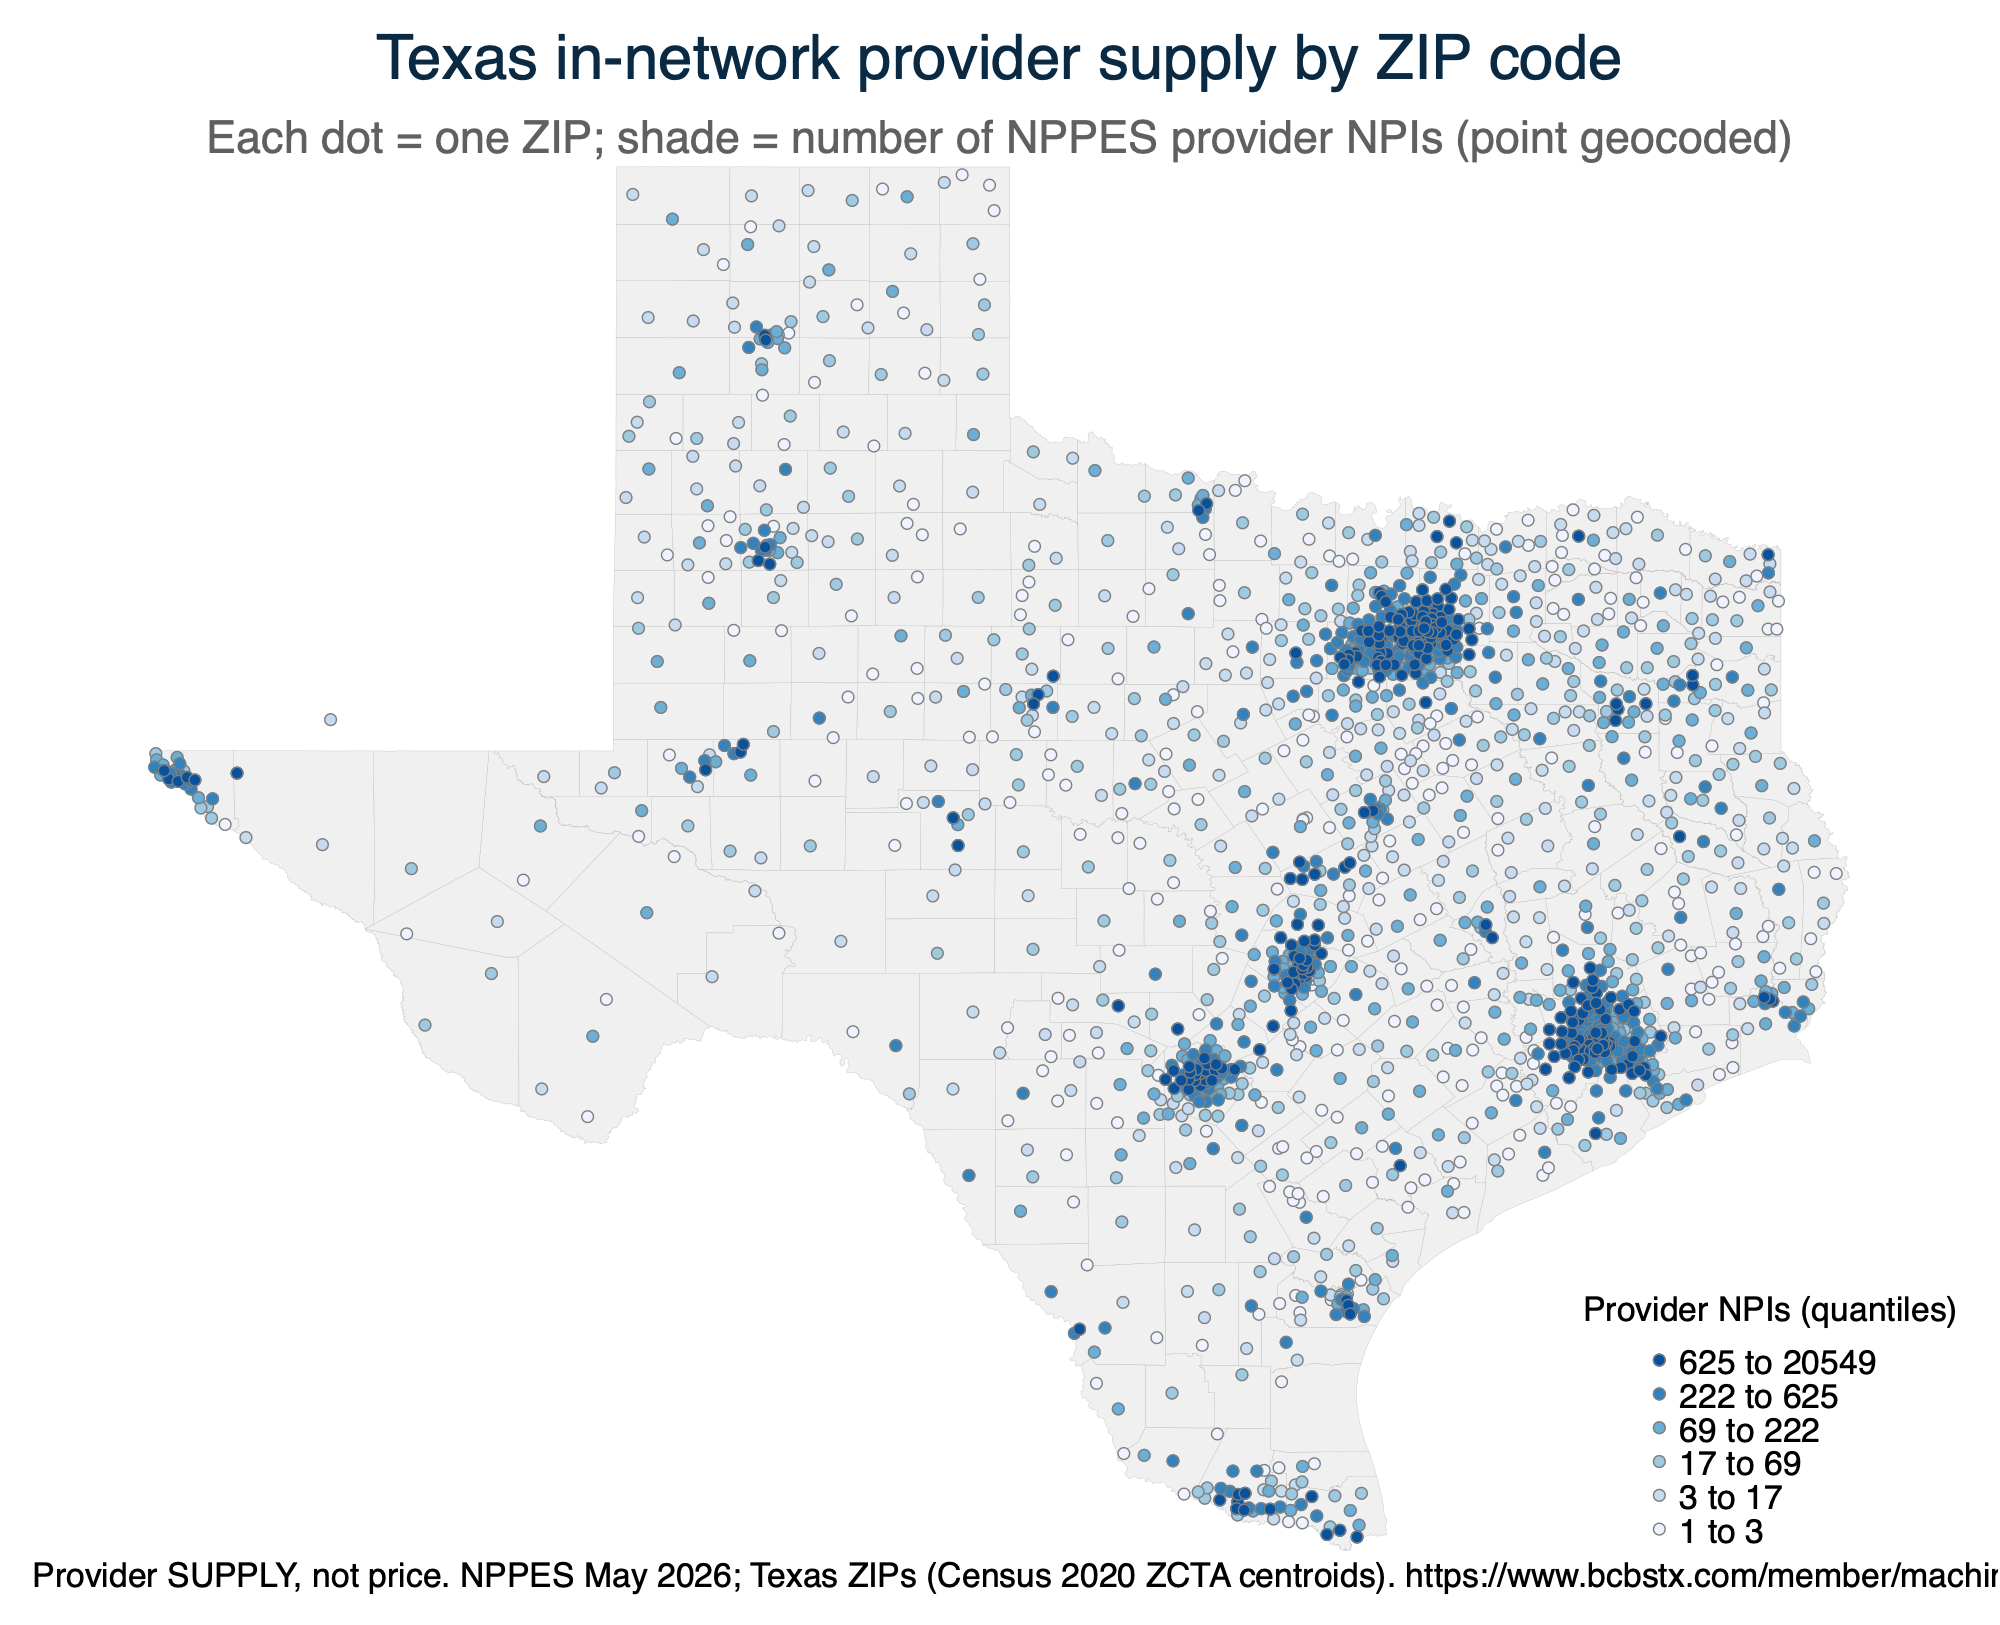
The finest geography we map. Each Texas ZIP code is one point (its Census 2020 ZCTA centroid), shaded by the number of NPPES provider NPIs practicing there. Like the district map this is provider SUPPLY (a count), NOT price: prices are collapsed at the county level, so there is no ZIP-level price to map without a ZIP-keyed re-extraction. The metros (Dallas–Fort Worth, Houston, San Antonio, Austin, El Paso, the Rio Grande Valley) light up as expected.
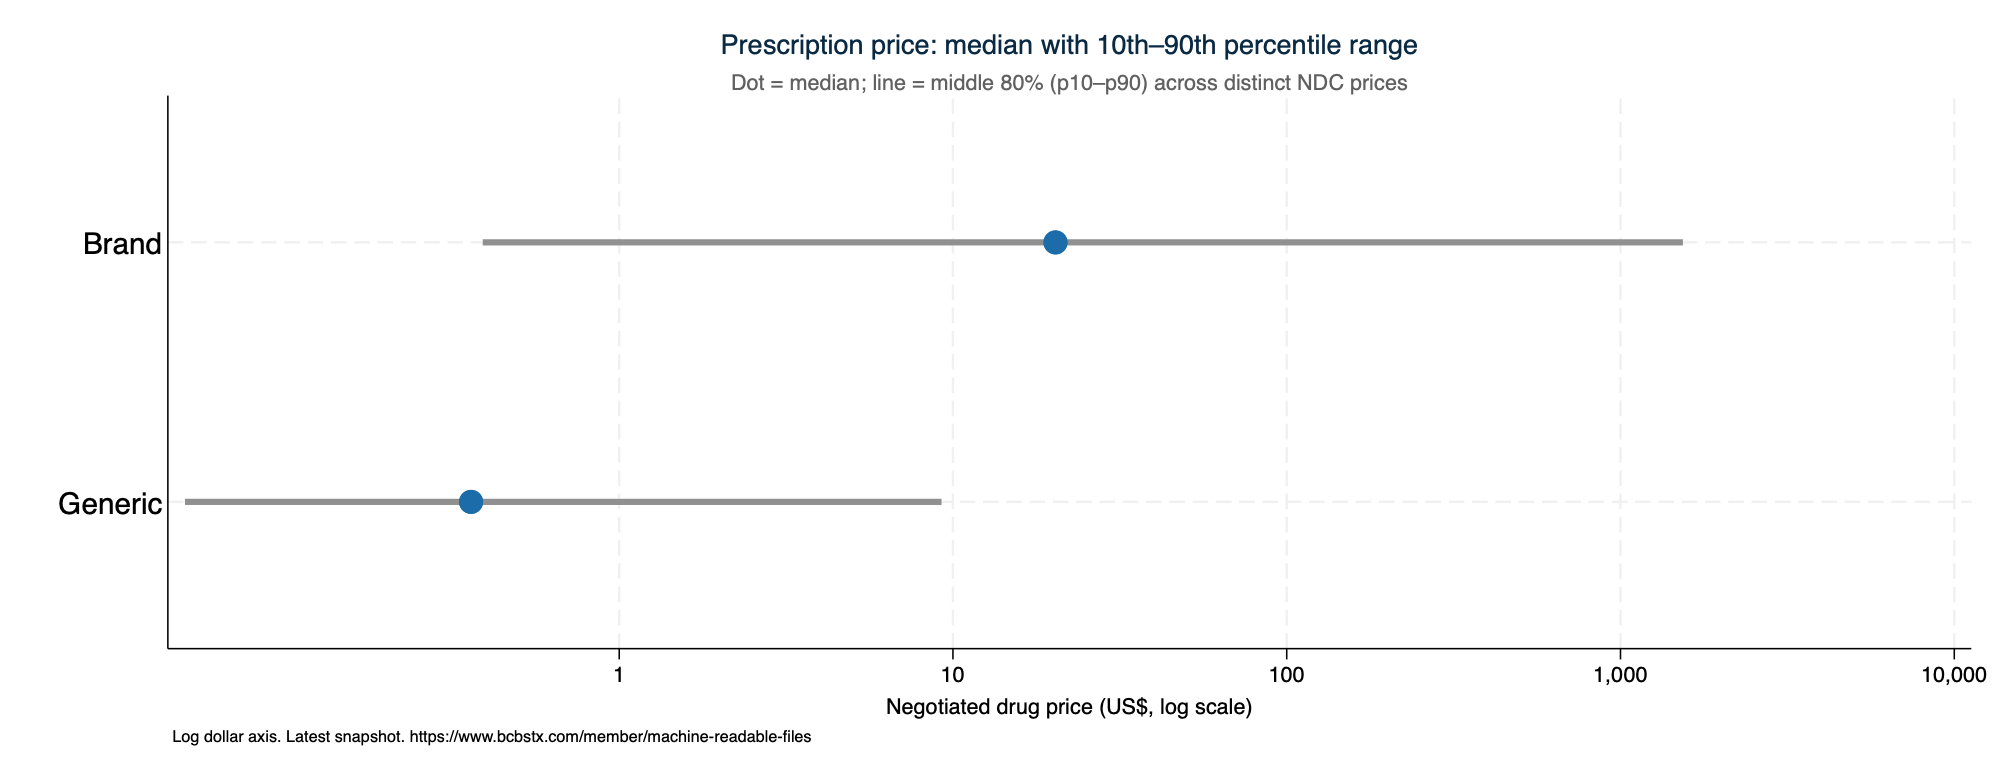
From the separate Rx table: brand vs generic price levels, the dispensing-fee distribution, and same-NDC price dispersion across the pharmacy network.
.     di as txt "Negotiated drug price by type (brand vs generic):"
Negotiated drug price by type (brand vs generic):

.     tabstat negotiated_rate, by(drug_type) statistics(p50 p90 mean n) format(%9.2fc) nototal

Summary for variables: negotiated_rate
Group variable: drug_type (Drug type (brand / generic / specialty))

drug_type |       p50       p90      Mean         N
----------+----------------------------------------
    Brand |     20.29  1,538.58 36,367.97 686346.00
  Generic |      0.36      9.24     11.69 507305.00
---------------------------------------------------

.     di as txt _n "Dispensing fee distribution:"

Dispensing fee distribution:

.     summarize dispensing_fee, detail

                    Dispensing fee (US$)
-------------------------------------------------------------
      Percentiles      Smallest
 1%            0              0
 5%            0              0
10%            0              0       Obs           1,193,651
25%            0              0       Sum of wgt.   1,193,651

50%           .2                      Mean           .3063055
                        Largest       Std. dev.      .5723852
75%          .35           3.75
90%           .6           3.75       Variance       .3276249
95%          1.5           3.75       Skewness       4.290039
99%         3.75           3.75       Kurtosis       24.50975
.     di as txt _n "NDCs with the widest same-drug price spread (max/min), n-prices>=10:"

NDCs with the widest same-drug price spread (max/min), n-prices>=10:
.     list drug_name ndc rxmin rxmax rxspread if _one & _np>=10 in 1/`=min(_N,12)', noobs sep(0) abbreviate(24)

  +----------------------------------------------------+
  | drug_name           ndc   rxmin   rxmax   rxspread |
  |----------------------------------------------------|
  | ISONIAZID   00555006602     .01    2.18        218 |
  +----------------------------------------------------+
Whether disclosure compresses the price distribution over time (Turquoise convergence method: percent change by price quartile across monthly snapshots). With a single snapshot this is intentionally skipped.
This is our standing, plain-English scorecard: for each standard price-transparency analysis, can we do it with the data we have right now? The status column is one of three things:
The last column (unlock_or_note) gives the specific next step or caveat for each row. The table is also written to 03_output/feasibility_matrix.csv so it travels with the data.
| Analysis | Status | Unlock / note |
|---|---|---|
| Price dispersion (shoppable services) | Feasible now | core analysis; this run |
| Professional vs facility decomposition | Feasible now | this run |
| Cross-network / fully-insured vs self-funded | Feasible now | this run |
| Rx brand-vs-generic, dispensing fees | Feasible now | this run |
| Site-of-care: office (POS11) vs HOPD (POS22) | Not separable | BCBSTX prof rate spans a POS set; use prof-vs-facility instead |
| Commercial-to-Medicare ratio (RAND-style) | Feasible now | MPFS/OPPS/IPPS joined, national GPCI=1.0; this run (labs lack a CLFS amount) |
| Geographic variation (county / region) | Feasible now | NPPES ZIP->county->region; county + Public Health Region price maps this run |
| Price by legislative district | Feasible now | APPROX (county->district) done this run; EXACT needs a district-keyed re-extraction |
| Provider supply by district / ZIP | Feasible now | Senate-district and ZIP point-supply maps this run |
| Cross-payer benchmarking | Needs addition | run UHC/Aetna/Cigna through the same pipeline (new payer config) |
| Time trends / price convergence | Needs >=2 snapshots | stack future monthly pulls, then re-run |
| Volume-weighted spending / utilization | Not feasible | MRFs carry no volume (inherent limitation) |
| Market concentration (HHI) vs price | Not feasible | needs clean hospital identity (CCN) + volume-based market shares |
| Price vs quality value scatter | Needs addition | join CMS Hospital Compare star ratings |
Two expansions were ADDED in this run and now appear above: the Medicare benchmark (section 5) and Public Health Region geography (section 6). The items below remain future opportunities; the first is highest-leverage.